South Florida Condo Fee Index · updated daily · as of October 18, 2026 · Miami, Miami-Dade County, Florida
Miami condo fees: $981 monthly median in the retained sample after exclusions and trimming
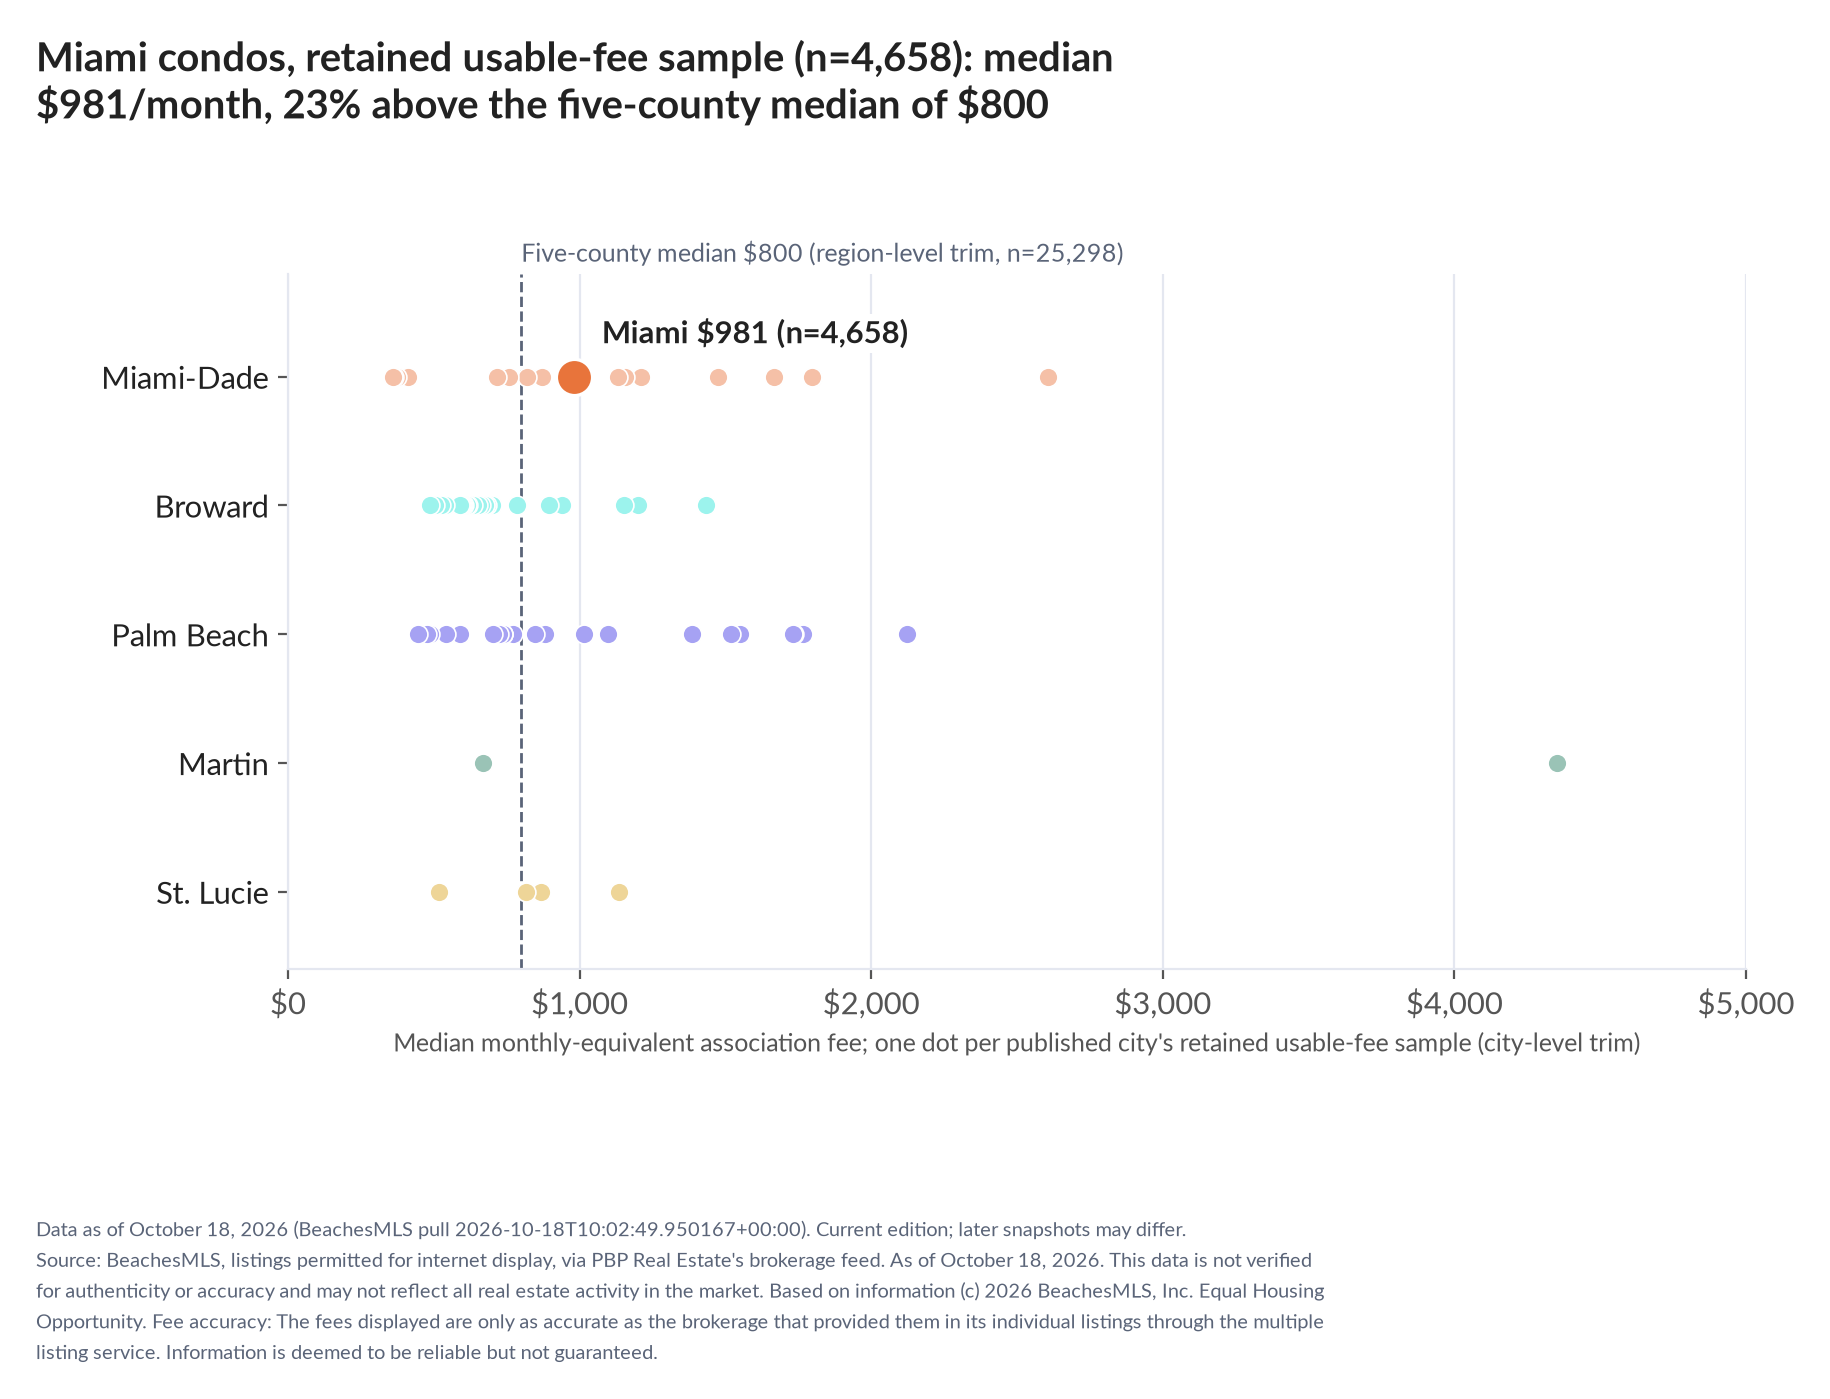
As of October 18, 2026, the median monthly-equivalent fee for Miami condominiums is $981 in the retained usable-fee sample after exclusions and percentile trimming: 4658 retained of 4885 active listings (4745 valid fees before trimming). 25th and 75th percentiles: $601 and $1,540.
The fees displayed are only as accurate as the brokerage that provided them in its individual listings through the multiple listing service. Information is deemed to be reliable but not guaranteed.
Source: PBP Real Estate analysis of BeachesMLS listings permitted for internet display. Fee measures use the retained usable-fee sample after exclusions and geography-specific percentile trimming; recorded monthly equivalents, not verified payments. As of Oct 18, 2026. Retained sample n=4658, after exclusions and each geography's p1/p99 trim. Year, area and price measures require usable fields: fee per area uses LivingArea ≥300, n=4515; annual fee/price uses ListPrice ≥$20,000, n=4658.
For buyers and sellers: Use the sample as a comparison, not a unit-specific budget. Ask for the association budget, current fees, coverage and special assessments; a listing does not verify them.
The story for media: "The median monthly fee in Miami's retained usable-fee sample after exclusions and percentile trimming is $981, compared with $800 in the separately trimmed five-county sample, according to PBP Real Estate analysis of BeachesMLS as of October 18, 2026."
For sellers
Pricing a home is a skill. Start with the current competition and recent closed sales.
37.5% of active condo listings in Miami have a recorded asking price below their original list price. For fee comparisons, the retained usable-fee sample after exclusions and percentile trimming contains 4,658 listings.
The data comes from the segment and recorded fields available in PBP Real Estate's BeachesMLS feed, as of the date shown. Gia Freer, Broker of Record, turns comparable sales and current competition into one written pricing opinion for your condo, with the reasoning, before it goes live.
No website estimate, no automated number: a written opinion of value prepared by hand, within one business day.
Request a pricing opinion for your property
Buying instead? Browse Miami listings with the fee shown on every unit, or compare every South Florida city.
Selling a condo? Pricing correctly is a skill. Gia Freer prices yours from this data, with the association fee factored in.
Ask Ava about this dataPrice my condo correctlyFee medians can change when the listing mix changes; they do not track the same owners' charges. 87 of 4745 valid-fee records were outside the city percentile boundaries, not verified errors.
Association fees are part of a buyer's carrying-cost comparison. In the dated retained sample for Miami, compare the median, distribution, recorded construction-year and asking-price groups. Coverage fields and remark flags are prompts to request current association documents, not verified charges or explanations of why fees differ.
Key takeaways
- Miami median condo fee: $981/mo across 4,658 retained listings as of October 18, 2026, 23% above the South Florida median of $800/mo (23th highest of 69 tracked cities).
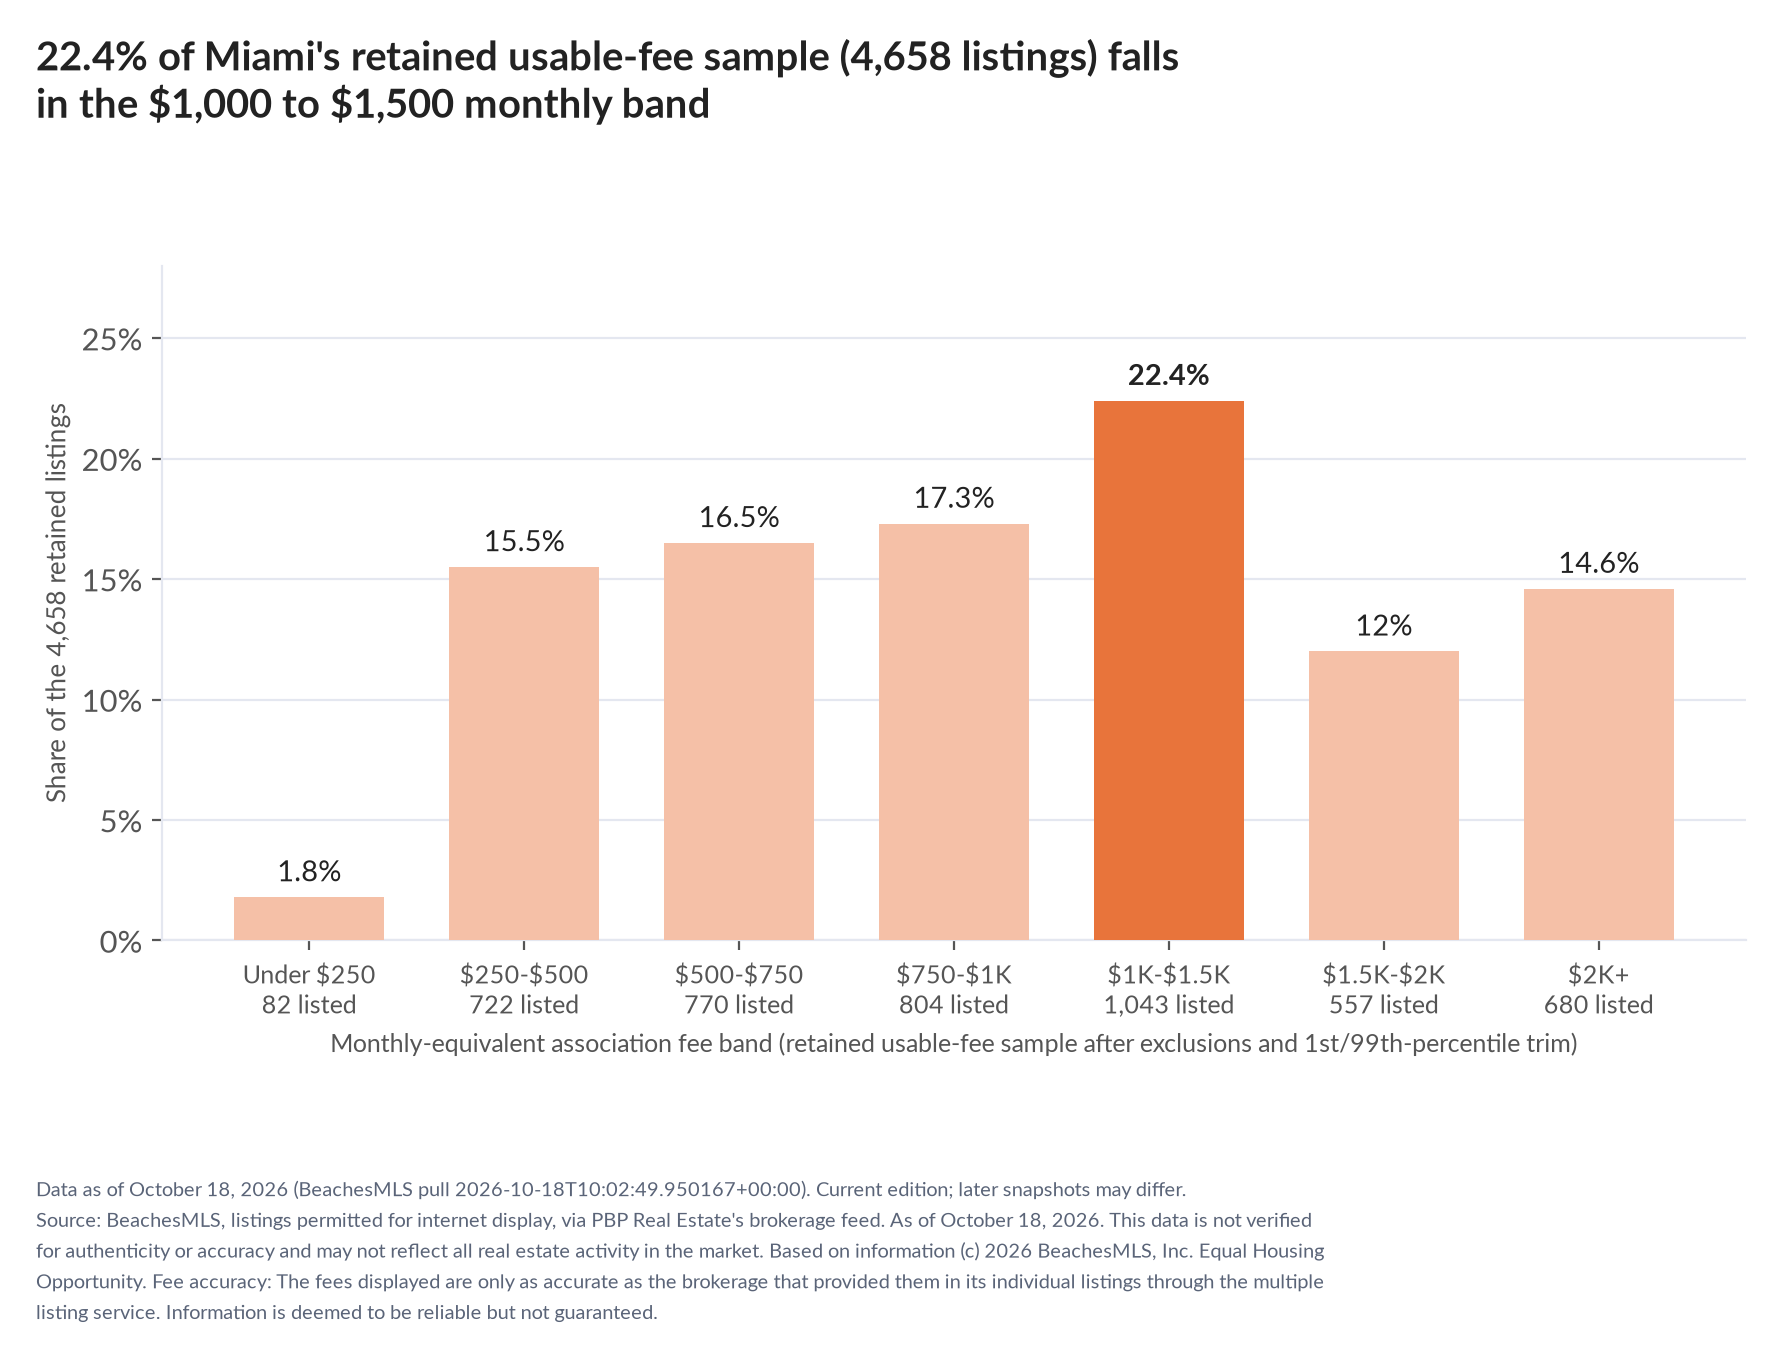
- The middle half of Miami fees runs $601 to $1,540 a month; 17.3% are under $500 and 48.9% are $1,000 or more.
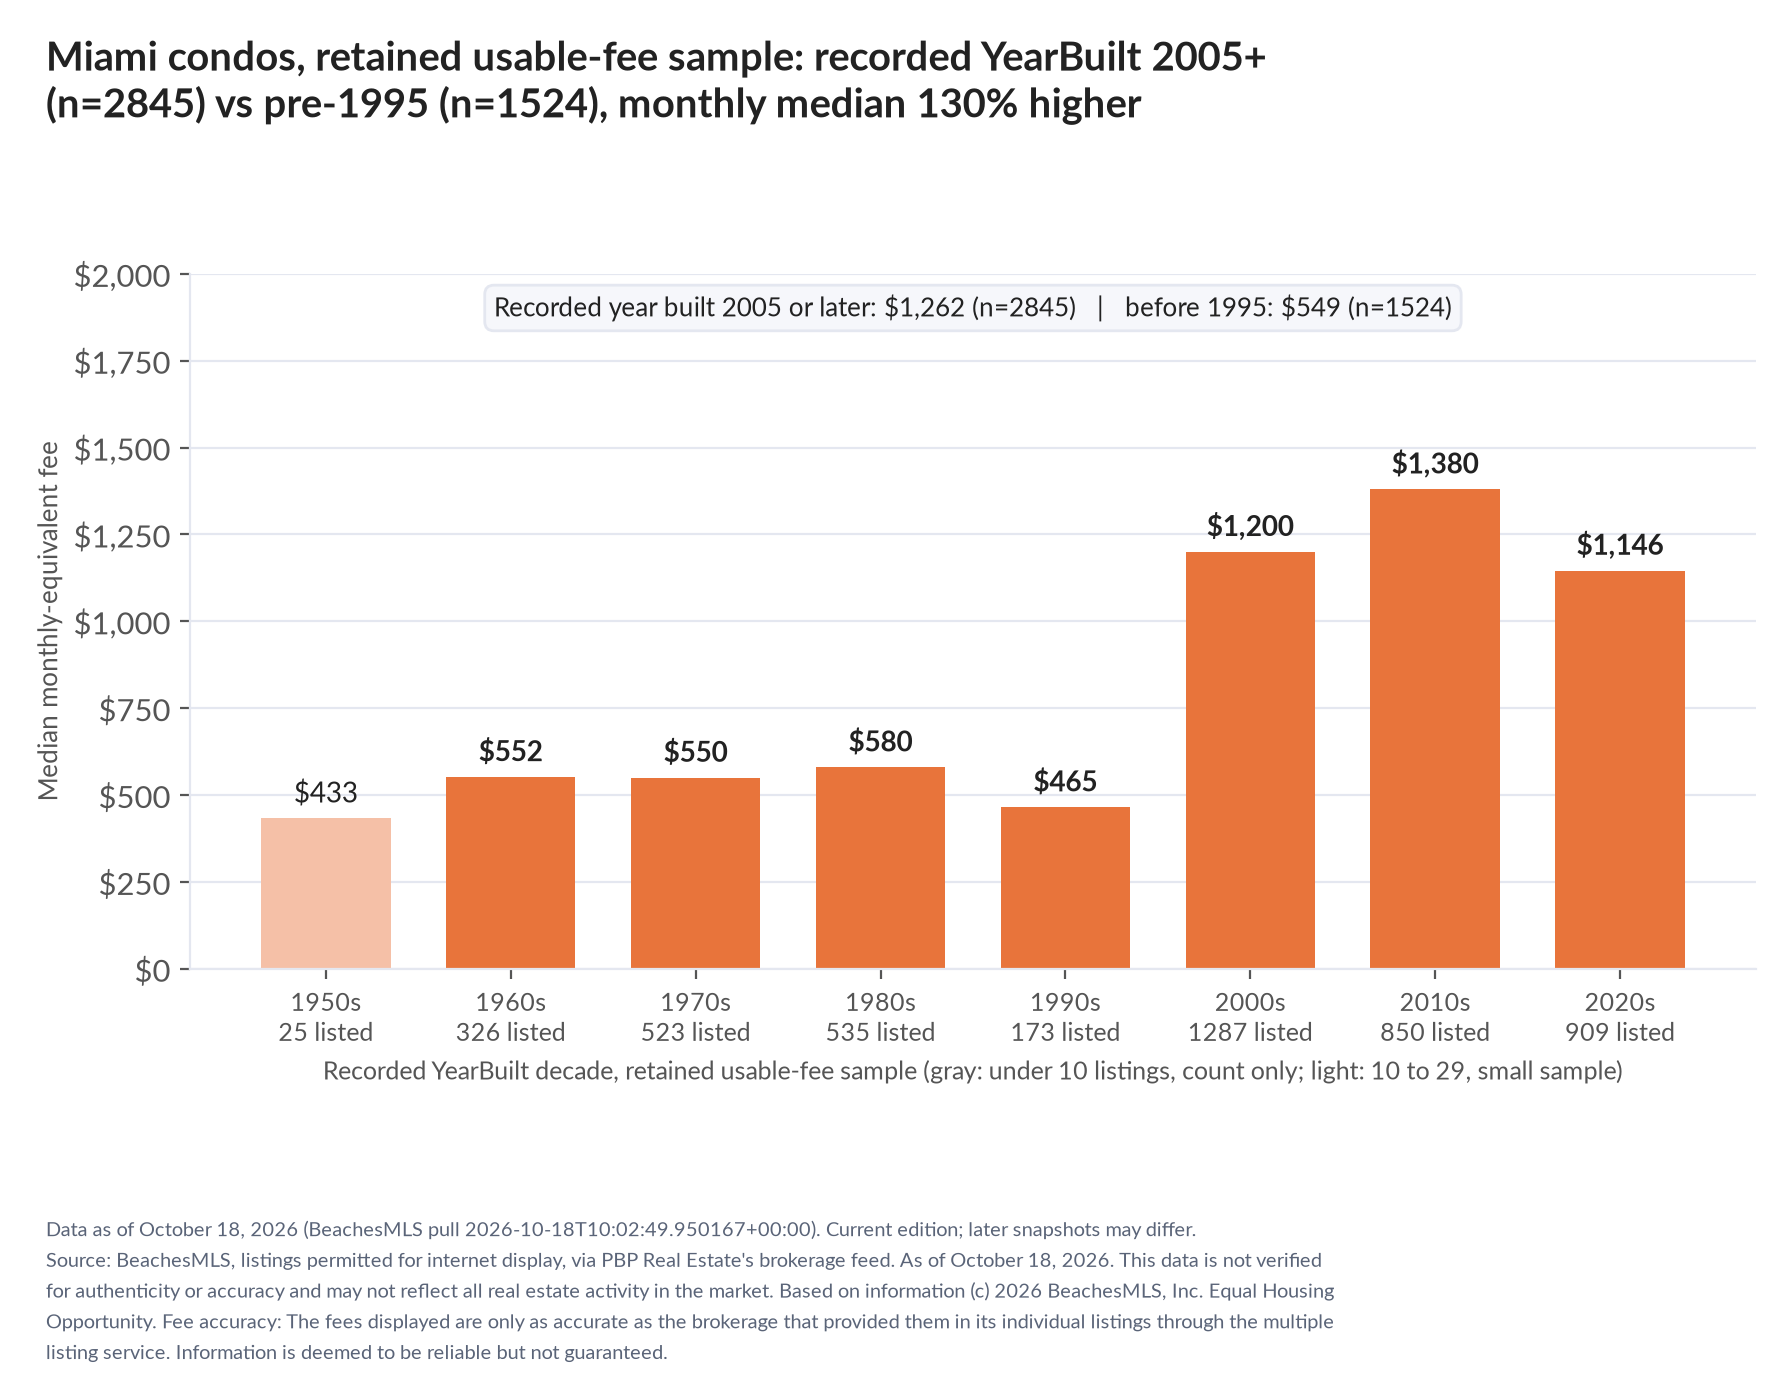
- Post-2005 construction carries a median fee 130% above pre-1995 construction ($1,262/mo vs $549/mo).
- 294 of 4,651 listings (6.3%) mention a special assessment in public remarks; that is what agents wrote, not an association fact.
- 156 Miami condominium developments have their own daily report page linked below.
How are recorded monthly fees distributed in Miami's retained sample?
Source: PBP Real Estate analysis of BeachesMLS listings permitted for internet display. Fee measures use the retained usable-fee sample after exclusions and geography-specific percentile trimming; recorded monthly equivalents, not verified payments. As of Oct 18, 2026. Retained sample n=4658, after exclusions and each geography's p1/p99 trim. Year, area and price measures require usable fields: fee per area uses LivingArea ≥300, n=4515; annual fee/price uses ListPrice ≥$20,000, n=4658.
In the retained usable-fee sample after exclusions and trimming, 17.3% are below $500 monthly and 48.9% are $1,000 or more. 25th and 75th percentiles: $601 and $1,540. Separate medians for fee, area and asking price do not describe one “median unit.”
How do Miami condo fees vary by construction decade?
Source: PBP Real Estate analysis of BeachesMLS listings permitted for internet display. Fee measures use the retained usable-fee sample after exclusions and geography-specific percentile trimming; recorded monthly equivalents, not verified payments. As of Oct 18, 2026. Retained sample n=4658, after exclusions and each geography's p1/p99 trim. Year, area and price measures require usable fields: fee per area uses LivingArea ≥300, n=4515; annual fee/price uses ListPrice ≥$20,000, n=4658.
In Miami's retained usable-fee sample after exclusions and percentile trimming, 2845 listings recorded as built in 2005 or later have a median monthly fee of $1,262; 1524 recorded as built before 1995 have a median of $549. Groups of 10–29 require caution. This does not identify the cause of a difference. Ask for the association budget and applicable inspection and reserve documents; the age comparison does not determine legal obligations or what a fee covers.
How do Miami condo fees change with asking price?
| Asking price band | Listings | Median fee / month | Fee as share of price / year |
|---|---|---|---|
| Under $250K | 620 | $496 | 3.28% |
| $250K to $500K | 1,703 | $695 | 2.29% |
| $500K to $1M | 1,441 | $1,261 | 2.23% |
| $1M and up | 894 | $2,392 | 1.44% |
Source: PBP Real Estate analysis of BeachesMLS listings permitted for internet display. Fee measures use the retained usable-fee sample after exclusions and geography-specific percentile trimming; recorded monthly equivalents, not verified payments. As of Oct 18, 2026. Retained sample n=4658, after exclusions and each geography's p1/p99 trim. Year, area and price measures require usable fields: fee per area uses LivingArea ≥300, n=4515; annual fee/price uses ListPrice ≥$20,000, n=4658. Rows under 10 listings are not read.
The annual-fee/current-asking-price ratio compares recorded carrying costs within the retained sample. It does not prove that fees rise with price or describe a buyer's final payment. Groups below 10 are not interpreted; 10–29 require caution.
What coverage is recorded in Miami? Shares use 4,124 retained listings with a coverage field
Source: PBP Real Estate analysis of BeachesMLS listings permitted for internet display. Fee measures use the retained usable-fee sample after exclusions and geography-specific percentile trimming; recorded monthly equivalents, not verified payments. As of Oct 18, 2026. Retained sample n=4658, after exclusions and each geography's p1/p99 trim. Year, area and price measures require usable fields: fee per area uses LivingArea ≥300, n=4515; annual fee/price uses ListPrice ≥$20,000, n=4658.
Two fees of $981 are not the same fee if one includes building insurance, water and a reserve contribution and the other does not. Compare coverage first, dollars second. Where the MLS record leaves the field blank the listing is simply not counted here.
What sits on top of the fee in Miami? Special assessments, memberships and leases
These keyword flags use all 4,658 retained records after exclusions and trimming, including records without remarks. Land-lease flags also use the recorded land-lease field. We add no charges inferred from remarks. Neither positive nor blank flags independently verify an obligation or its absence.
Source: PBP Real Estate analysis of BeachesMLS listings permitted for internet display. Fee measures use the retained usable-fee sample after exclusions and geography-specific percentile trimming; recorded monthly equivalents, not verified payments. As of Oct 18, 2026. Retained sample n=4658, after exclusions and each geography's p1/p99 trim. Year, area and price measures require usable fields: fee per area uses LivingArea ≥300, n=4515; annual fee/price uses ListPrice ≥$20,000, n=4658. Remarks classified by keyword; 4,651 of 4,658 listings carry public remarks.
Which Miami developments are for sale, and what do they ask in fees?
156 Miami development reports go deeper than this table: fee position, twelve months of closed sales, price cuts, unit mix and enclave or tower breakdowns, updated daily. Linked names below open them.
Displayed development groups within the retained city sample after exclusions and trimming, capped at 60. This is not a census of all communities. Names are normalized MLS text and may split or combine spelling variants. Fewer than 10 is anecdotal; 10–29 requires caution. Flags use retained records in each group. Main fee medians and retained counts remain shown; group fee-per-area, construction-year and asking-price medians are withheld (—) because their separate qualifying counts are unavailable, not because those values are proven wrong.
Largest developments, 20 or more condos for sale (53)
| Development | Master community | For sale | Median fee / mo | Per sq ft | Built | Median asking | Assessment | Membership |
|---|---|---|---|---|---|---|---|---|
| Paramount Miami Worldcenter | — | 64 | $2,187 | — | — | — | 2 | — |
| Map of Miami Dade Co Fl Pb B 41 | — | 55 | $807 | — | — | — | 0 | — |
| Iconbrickell | — | 45 | $1,379 | — | — | — | 1 | — |
| Icon Brickell | — | 43 | $1,865 | — | — | — | 1 | — |
| Opera Tower | — | 43 | $970 | — | — | — | 2 | — |
| Montecarlo | — | 41 | $671 | — | — | — | 6 | — |
| District 225 | — | 39 | $871 | — | — | — | 0 | — |
| Paraiso Bayviews | — | 38 | $1,305 | — | — | — | 0 | — |
| The Standard Residences | — | 37 | $805 | — | — | — | 0 | — |
| 1300 S Miami Avenue | — | 36 | $1,362 | — | — | — | 0 | — |
| Aston Martin Residences | — | 36 | $3,202 | — | — | — | 0 | — |
| Rise | — | 36 | $2,142 | — | — | — | 1 (1 pending) | — |
| Venetia | — | 36 | $1,160 | — | — | — | 9 (1 pending) | — |
| 501 First Residences | — | 35 | $674 | — | — | — | 0 | — |
| 801 Sma Residences | — | 35 | $1,876 | — | — | — | 0 | — |
| Icon Brickell No Two | — | 35 | $1,580 | — | — | — | 3 | — |
| The Crosby | — | 34 | $830 | — | — | — | 0 | — |
| 50 Biscayne | — | 32 | $932 | — | — | — | 2 | — |
| Vizcayne South | — | 32 | $1,217 | — | — | — | 7 | — |
| Buckley Towers Ea | — | 31 | $552 | — | — | — | 1 (1 pending) | — |
| Echo Brickell | — | 31 | $2,810 | — | — | — | 0 | — |
| Aria On the Bay | — | 30 | $1,242 | — | — | — | 0 | — |
| 3401 Midtown | — | 29 | $1,159 | — | — | — | 0 | — |
| Epic West | — | 29 | $2,454 | — | — | — | 4 | — |
| The Club at Brickell Bay | Brickell Bay | 29 | $706 | — | — | — | 1 | — |
| Brickell Flatiron | — | 28 | $1,885 | — | — | — | 0 | — |
| Met 12 layers | — | 28 | $1,251 | — | — | — | 0 | — |
| Casa Bella Residences | — | 27 | $1,500 | — | — | — | 0 | — |
| Brickell Heights West Con | — | 26 | $1,326 | — | — | — | 0 | — |
| Miami North | — | 26 | $1,126 | — | — | — | 0 | — |
| Mint | — | 26 | $1,280 | — | — | — | 0 | — |
| Toscano | — | 26 | $1,336 | — | — | — | 3 (1 pending) | — |
| Towers of Quayside | — | 26 | $1,937 | — | — | — | 8 | — |
| Brickell Heights East Cond | — | 25 | $1,269 | — | — | — | 0 | — |
| Infinity at Brickell Cond | Brickell Cond | 25 | $1,500 | — | — | — | 0 | — |
| Quantum On the Bay North | — | 25 | $1,100 | — | — | — | 1 (1 pending) | — |
| Reach | — | 25 | $2,137 | — | — | — | 0 | — |
| Una Residences | — | 25 | $3,404 | — | — | — | 0 | — |
| 1100 Millecento Residences | — | 24 | $897 | — | — | — | 2 | — |
| Ivy | — | 24 | $1,282 | — | — | — | 2 | — |
| 1060 Brickell | — | 23 | $1,232 | — | — | — | 2 (1 pending) | — |
| Mar Len Gardens Corp Co Op | — | 23 | $750 | — | — | — | 0 | — |
| Nine at Mary Brickell Village | Mary Brickell Vil | 23 | $1,261 | — | — | — | 0 | — |
| Quadro | — | 23 | $1,153 | — | — | — | 0 | — |
| Vizcayne North | — | 23 | $1,294 | — | — | — | 2 | — |
| Wind | — | 23 | $1,050 | — | — | — | 0 | — |
| Centro | — | 22 | $654 | — | — | — | 0 | — |
| Gran Paraiso2 layers | — | 22 | $1,802 | — | — | — | 0 | — |
| Terrazas Riverpark Village | — | 22 | $1,208 | — | — | — | 1 | — |
| Two Midtown Miami | — | 22 | $1,606 | — | — | — | 1 | — |
| Paraiso Bay | — | 21 | $1,324 | — | — | — | 0 | — |
| Brickell On the River S Twr2 layers | — | 20 | $940 | — | — | — | 1 | — |
| Cite | — | 20 | $1,034 | — | — | — | 2 | — |
Developments with 10 to 19 condos for sale (7)
| Development | Master community | For sale | Median fee / mo | Per sq ft | Built | Median asking | Assessment | Membership |
|---|---|---|---|---|---|---|---|---|
| Biscayne Beach | — | 19 | $1,508 | — | — | — | 1 | — |
| Canvas | — | 19 | $885 | — | — | — | 0 | — |
| Grove Isle | — | 19 | $3,618 | — | — | — | 0 | — |
| Marinablue | — | 19 | $1,312 | — | — | — | 5 | — |
| One Miami East | — | 19 | $1,017 | — | — | — | 0 | — |
| The Axis On Brickell Ii C2 layers | — | 19 | $1,190 | — | — | — | 2 (1 pending) | — |
| The Loft Downtown Ii Cond | — | 19 | $765 | — | — | — | 0 | — |
Where the development figures come from
Source: PBP Real Estate analysis of BeachesMLS listings permitted for internet display. Fee measures use the retained usable-fee sample after exclusions and geography-specific percentile trimming; recorded monthly equivalents, not verified payments. As of Oct 18, 2026. Retained sample n=4658, after exclusions and each geography's p1/p99 trim. Year, area and price measures require usable fields: fee per area uses LivingArea ≥300, n=4515; annual fee/price uses ListPrice ≥$20,000, n=4658. Linked development names open a full report with sold prices and fee history.
Recorded master-community groups in Miami: Brickell Bay: 29 retained records, median not headlined below 30; Brickell Condo: 26 retained records, median not headlined below 30; Brickell Cond: 22 retained records, median not headlined below 30; Dadeland: 21 retained records, median not headlined below 30; Mary Brickell Vil: 21 retained records, median not headlined below 30; Kendall Con: 17 retained records, median not headlined below 30; Bricke: 12 retained records, median not headlined below 30; Dadeland Condo: 10 retained records, median not headlined below 30; Fountains: 10 retained records, median not headlined below 30; Calif Cl: 6 retained records, median not headlined below 30; Brickell: 5 retained records, median not headlined below 30; The Hammock: 5 retained records, median not headlined below 30. Groups of 30–39 require caution; names do not independently verify association structure.
All 156 Miami development reports
Available Miami development reports compare fees, closed sales, recorded asking-price differences and unit mix. Refresh is scheduled daily; use each report's own date, qualifying counts and methodology.
Miami developments: 0-9
- 801 Sma Residences
- 1300 S Miami Avenue
- 3401 Midtown
- 50 Biscayne
- 900 Biscayne Bay
- 501 First Residences
- 1010 Brickell
- 1800 Club
- 1060 Brickell
- 1100 Millecento Residence
- 500 Brickell West
- 4250 Biscayne Boulevard
- 500 Brickell East
- 1800 Biscayne Plaza
- 159 Ne 6Th Street
- 801 Sma Designer Suites
Miami developments: A
Miami developments: B
- Brickell Bay
- Brickell On the River
- Brickell Heights East
- Biscayne Beach
- Brickell Condo
- Brickell Flatiron
- Buckley Towers Ea
- Brickell Place
- Brickell Heights West
- Brickell Key Ii
- Brickell Key One
- Brickellhouse
- Blue Lagoon
- Bay House Miami
- Brickell Ten
- Bristol
- Brickell Townhouse
Miami developments: C
- Canvas
- Centro
- Casa Bella Residences
- Carbonell
- Cricket Club
- Century Park
- Courvoisier Courts
- Charter Club
- Coral Plaza of Miami
- Crossings Village Homes
- Carmel Lakes
Miami developments: D
Miami developments: E
Miami developments: F
Miami developments: G
- Gran Paraiso
- Grove Isle
- Gables Marquis
- Green Hills Park West
- Golden
- Gables Court
- Greenglades
- Gale Residences
Miami developments: H
Miami developments: I
Miami developments: J
Miami developments: K
Miami developments: L
Miami developments: M
- Montecarlo
- Met 1
- Marinablue
- Mar Len Gardens Corp
- Mary Brickell Vil
- Midblock Miami
- Mr C Residences
- Marquis
- Madison Downtown
- Mutiny Park
- Miller Gardens
- Mybrickell
- Monterey Village Two
- Millennium Tower
Miami developments: N
Miami developments: O
Miami developments: P
Miami developments: Q
Miami developments: R
Miami developments: S
- Sunset Villas
- Snapper Village
- Sunset Palm Villas
- Spanish Trace
- Smart Brickell
- Skyline On Brickell
- Star Lakes Estates
- Summertree Vilg Calif Cl
- Summit Chase
Miami developments: T
- Towers of Quayside
- Toscano
- Two Midtown Miami
- The Standard Residences
- The Crosby
- The Loft Downtown Ii
- Terrazas Riverpark Villag
- The Axis On Brickell Ii
- The Plaza 851 Brickell
- The Plaza 901 Brickell
- The Towers of Quayside
- Ten Museum Pk Residential
- The Mark On Brickell
- The Horizons
- The Bondo 1080 Brickell
- The Beach Club Fontainebl
- The Aston
- The Tower Residences
- The Crosby Miami Worldcent
Miami developments: U
Miami developments: V
- Vizcayne South
- Village of Kings Creek
- Verabella Falls
- Villa Regina
- Venetian Palms
- Vilg Homes Country Walk
Miami developments: W
Miami developments: Y
Are Miami condo fees rising? Trend since tracking began
Source: PBP Real Estate analysis of BeachesMLS listings permitted for internet display. Fee measures use the retained usable-fee sample after exclusions and geography-specific percentile trimming; recorded monthly equivalents, not verified payments. As of Oct 18, 2026. Retained sample n=4658, after exclusions and each geography's p1/p99 trim. Year, area and price measures require usable fields: fee per area uses LivingArea ≥300, n=4515; annual fee/price uses ListPrice ≥$20,000, n=4658.
More live Miami data
PBP Real Estate analysis of BeachesMLS listings. Refresh is scheduled daily; read each index’s own date and sample.
Own a home or condo in Miami? What is my home worth in Miami? Current sale prices, houses and condos separate · Selling a house in Miami: what it takes and what mispricing costs
For journalists: the Miami condo fee numbers, ready to run
The English news kit offers headline options, a lede, a fact box, quotes, standalone charts and methodology. Use the download's own figures, statistical date and revision notice; it is not necessarily the same edition as this page. Current-kit refresh is scheduled daily. Free to reuse with attribution to PBP Real Estate analysis of BeachesMLS listing data. No form, no gate.
Headline options today
- Miami condo monthly association fees have a median of $981 in the retained usable-fee sample of 4,658 listings, 23% above the five-county median
- In Miami's retained usable-fee sample (4,658 listings after exclusions and percentile trimming), 48.9% have monthly-equivalent fees of $1,000 or more and 17.3% are below $500
- Miami condos, retained usable-fee sample: recorded YearBuilt 2005+ (n=2845) vs pre-1995 (n=1524), monthly median 130% higher
Quotable
"The median monthly-equivalent association fee in Miami's retained usable-fee sample (n=4,658), after exclusions and percentile trimming, is $981, compared with $800 in the separately trimmed five-county sample."
Download
- Full press kit (zip, 1314 KB): PDF, plain text, three PNG charts, captions and alt text
- Journalist package (PDF)
- Plain text, paste-ready
- Miami condos, retained usable-fee sample (n=4,658): median $981/month, 23% above the five-county median of $800 (PNG)
- 22.4% of Miami's retained usable-fee sample (4,658 listings) falls in the $1,000 to $1,500 monthly band (PNG)
- Miami condos, retained usable-fee sample: recorded YearBuilt 2005+ (n=2845) vs pre-1995 (n=1524), monthly median 130% higher (PNG)
Need a number or a licensed quote
Gia Freer, Broker of Record (Lic. BK689801) · 561-395-8418 · info@pbpre.com · same-day response Monday to Saturday. All city kits: pbprealestate.com/press.
What should a buyer or seller do with these numbers?
Buyers
- Use $981 a month, or $1.15 per square foot, as the Miami midpoint; ask why a unit sits far outside $601 to $1,540.
- Ask for three documents before you fall in love: the current budget, the reserve study, and the latest milestone or structural report. 6.3% of Miami listings bring up a special assessment on their own.
- If the community has a master association, confirm both layers are in the quoted fee; 0.3% of Miami listings show two.
Sellers
- State the fee, its billing cycle and what it covers in the listing; buyers compare against this page and against 4,658 other Miami listings.
- If an assessment is paid or none is pending, say so plainly; 4% of your competition already does.
- A fee above $1,540 is not a defect if the coverage justifies it; list the coverage.
Media writers
- Angle: Miami condo fees run 23% above the five-county median ($981 vs $800); 48.9% of listings ask $1,000 or more. Post-2005 buildings ask 130% more than pre-1995 ones.
- Attribute page figures to PBP Real Estate analysis of BeachesMLS listing data, as of October 18, 2026. For a download, use its own date, figures and revision; refresh is scheduled daily, not guaranteed.
Questions people actually ask about Miami condo fees
What is the median fee in Miami?
As of October 18, 2026, the median monthly-equivalent fee for Miami condominiums is $981 in the retained usable-fee sample after exclusions and percentile trimming: 4658 retained of 4885 active listings (4745 valid fees before trimming). 25th and 75th percentiles: $601 and $1,540. 48.9% have fees of $1,000 or more; 17.3% are below $500. These are recorded fees, not verified payments.
How are fee frequencies and association layers handled?
Within the retained sample after exclusions and percentile trimming, 1.5% have quarterly frequency. Quarterly fees are divided by three, semiannual by six and annual by twelve. Usable MLS fee layers are summed. 13 of 4658 retained listings (0.3%) have a second layer. Unusable fee records are excluded rather than assigning a missing frequency.
What does the fee cover, and are assessment mentions verified?
Within the retained sample after exclusions and percentile trimming, 4124 listings record at least one coverage item: Common areas: 61.6%; Water: 61.2%; Trash: 57.2%; Sewer: 49.1%; Security: 41.5%; Structure maintenance: 41.5%. Coverage shares use that denominator. Assessment mentions are 294 of 4658 retained listings (6.3%), classified by keywords; no charges inferred from remarks are added to the fee. A blank field does not verify absence. Ask the association for current budget, coverage and charges.
How do fees compare by recorded construction year?
In Miami's retained usable-fee sample after exclusions and percentile trimming, 2845 listings recorded as built in 2005 or later have a median monthly fee of $1,262; 1524 recorded as built before 1995 have a median of $549. Groups of 10–29 require caution. This does not identify the cause of a difference.
Which communities have the lowest and highest displayed medians?
Within the retained sample after exclusions and percentile trimming, among displayed groups with at least 30 listings, the lowest medians are Buckley Towers Ea ($552) and highest Aston Martin Residences ($3,202). All ties at reported precision are included. Groups of 30–39 are small samples. The table is not a census of all communities; names depend on recorded fields and normalization.
Which denominators and date apply?
Fee statistics describe the retained usable-fee sample after exclusions and percentile trimming, not every property for sale. Monthly-equivalent fees below the 1st or above the 99th percentile are excluded within each geographic sample. City, county and five-county samples are trimmed separately; the region is not a median of city medians. Publication requires 30 valid-fee listings before trimming; retained n is stated separately. A city with 30–39 valid-fee listings is a small sample. Secondary measures use further qualifying fields and their own denominators. Retained sample n=4658, after exclusions and each geography's p1/p99 trim. Year, area and price measures require usable fields: fee per area uses LivingArea ≥300, n=4515; annual fee/price uses ListPrice ≥$20,000, n=4658. Data snapshot: October 18, 2026; publication and correction dates are separate. 87 of 4745 valid fees were excluded by percentile boundaries; they are not verified errors.
How to cite this page
Free to reuse with attribution and a link to PBP Real Estate. Copy the line below; the URL is permanent and always shows the latest figures.
PBP Real Estate analysis of BeachesMLS listing data, "Miami condo fees, South Florida Condo Fee Index," as of October 18, 2026, https://www.pbprealestate.com/condo-fees-miami/For a versioned edition, use its own figures, original statistical date and revision notice. Corrections are disclosed publicly and may produce a corrected reissue. The monthly snapshot may differ from this current page; do not attach today's figure to the monthly citation:
PBP Real Estate analysis of BeachesMLS listing data, "Miami condo fees, South Florida Condo Fee Index, October 2026," https://www.pbprealestate.com/press/miami/2026-10/Method: South Florida Condo Fee Index. Every kit and chart: pbprealestate.com/press. Questions or a licensed quote: Gia Freer, Broker of Record (Lic. BK689801), 561-395-8418.
How these figures are built
Snapshot 2026-10-18; retrieved 2026-10-18T10:02:49.950167+00:00; aggregate generated 2026-10-18T10:06:28+00:00; source 61349 rows, SHA-256 14078fdc9e36727f9c5cada343dfca8b449ce3b793e888f25471169fab8edd90. Statistical date, retrieval and publication are distinct. “Miami” groups the MLS City field within the five counties. It can span county lines and is not a municipal-boundary verification. The county comparison is calculated separately and can include this city's listings.Active segment counts by recorded county: Miami-Dade: 4885.
Quarterly fees are divided by three, semiannual by six and annual by twelve; usable association layers are summed. Unusable fee records are excluded rather than guessing frequency. Current-price-band annual ratios use positive asking prices in the band, n shown; the overall annual ratio uses ListPrice ≥$20,000. These denominators are not interchangeable.
Fee statistics describe the retained usable-fee sample after exclusions and percentile trimming, not every property for sale. Monthly-equivalent fees below the 1st or above the 99th percentile are excluded within each geographic sample. City, county and five-county samples are trimmed separately; the region is not a median of city medians. Publication requires 30 valid-fee listings before trimming; retained n is stated separately. A city with 30–39 valid-fee listings is a small sample. Secondary measures use further qualifying fields and their own denominators. Segments follow recorded tax legal description and MLS subtype. A legal description recording a condominium takes priority, including townhouse, villa or single-family forms. Condominium and Stock Cooperative subtypes remain condominiums when the legal is silent or describes a parent parcel, including new-build units. Remaining Townhouse and Villa listings are grouped in the HOA Fee Index; houses are remaining SingleFamilyResidence listings. These are analytical field classifications, not an independent determination of legal regime. “Miami” groups the MLS City field within the five counties. It can span county lines and is not a municipal-boundary verification. The county comparison is calculated separately and can include this city's listings. The fees displayed are only as accurate as the brokerage that provided them in its individual listings through the multiple listing service. Information is deemed to be reliable but not guaranteed.

All listings featuring the BMLS logo are provided by BeachesMLS, Inc. This information is not verified for authenticity or accuracy and is not guaranteed. Copyright © 2026 BeachesMLS, Inc.
IDX information is provided exclusively for consumers' personal, non-commercial use, and may not be used for any purpose other than to identify prospective properties consumers may be interested in purchasing. Data is deemed reliable but is not guaranteed accurate by the MLS. Data last updated October 18, 2026.
Moving to Miami
Moving to Miami? Everything in one place
- Moving to Miami guide — prices by area updated daily, houses and condos kept separate, Texas vs Florida taxes, and how to plan the search.
- Search homes for sale in Miami — live BeachesMLS search; email me new listings.
- Public schools: check the address — Miami-Dade County Public Schools assigns schools by address, not by neighborhood name. Check each address in the official locator before you sign.
- All 28 Miami-Dade cities — market data, guides and search for each one.