Monthly archive · October 2026
Pembroke Pines housing data, October 2026
This is dated Pembroke Pines housing data, not today's market. It covers price cuts and days on market, condo fees and HOA fees on townhouses and villas for listings as of October 1, 2026. The original monthly edition was frozen .
For today's figures use the live pages linked under each section.
Key takeaways
- 44.2% of the 231 single-family homes listed for sale in Pembroke Pines (102 listings) have a current asking price below their original list price, according to PBP Real Estate's analysis of BeachesMLS listing data as of October 1, 2026.
- Among 467 active condominium listings in Pembroke Pines retained after excluding unusable-fee records and trimming monthly-equivalent fees below the city's 1st or above its 99th percentile, the median monthly association fee is $683, with the middle half between $486 and $740.
- Among 83 active townhouse or villa listings in Pembroke Pines retained after excluding unusable-fee records and trimming monthly-equivalent fees below the city's 1st or above its 99th percentile, the median monthly homeowners association fee is $260, with the middle half between $192 and $346.
Pembroke Pines price cuts and days on market, October 2026
Listings as of October 1, 2026. Live page with today's figures: Pembroke Pines price cuts and days on market. Every city: South Florida price cuts and days on market.
Headline options
- 44.2% of Pembroke Pines houses for sale are asking less than their original list price; 49.9% of condos
- Seller Blink Rate™ in Pembroke Pines: 44.2% of houses list below original asking, against 44.1% across Broward County
- Buying in Pembroke Pines? 102 of the 231 houses for sale are asking below their original price, by a median $25K
Lede
PEMBROKE PINES, Fla., October 1, 2026 - 44.2% of the 231 single-family homes listed for sale in Pembroke Pines (102 listings) have a current asking price below their original list price, according to PBP Real Estate's analysis of BeachesMLS listing data as of October 1, 2026. Among those 102 reduced listings, the median reduction is 3.6% (about $25K). Among the city's 477 condominium listings, 49.9% are asking below their original price, by a median 7.4%.
Quotable
"44.2 percent of single-family homes for sale in Pembroke Pines have a current asking price below their original list price; among those 102 reduced listings the median reduction is $25K."
"Among active Pembroke Pines houses, the median recorded CumulativeDaysOnMarket value is 50 days and the median recorded DaysOnMarket value is 49 days. These are MLS-recorded fields, not an independently reconstructed listing history."
"At the snapshot, 35.6 percent of the 104 Pembroke Pines houses under contract had a recorded asking price below their original list price; the median reduction among that group was 3.6 percent. The remainder were not recorded as below their original list price, which is not a price history. Agreed contract prices are not inferred from these asking prices."
Charts and source labels
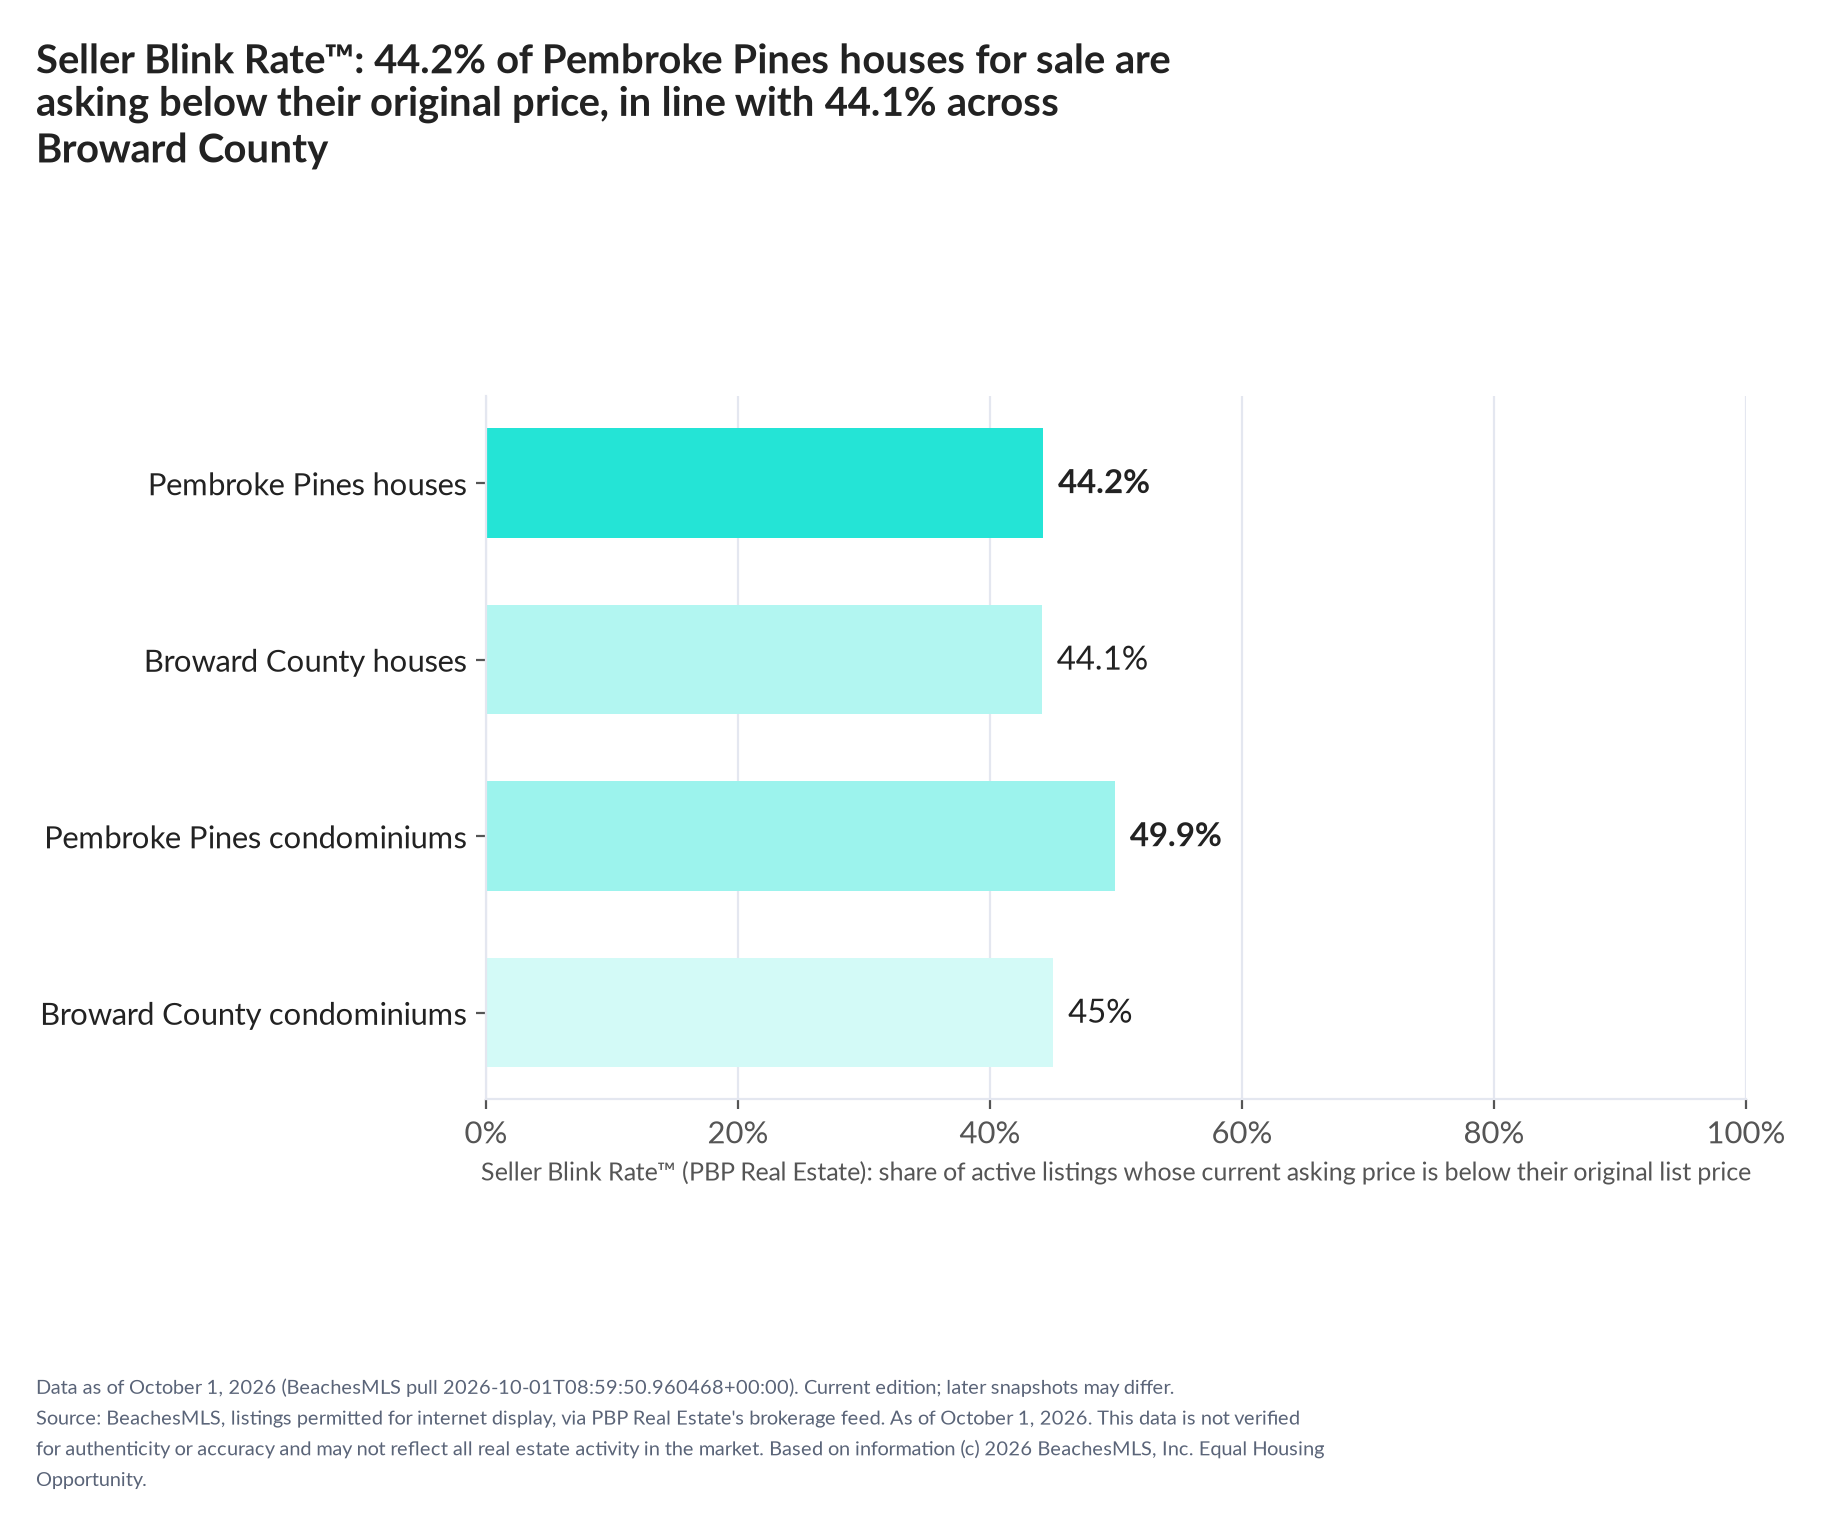
Seller Blink Rate™: share of active listings whose current asking price is below their original list price, Pembroke Pines versus Broward County, houses and condominiums, October 1, 2026. Not a price history. Source: BeachesMLS via PBP Real Estate. Download PNG
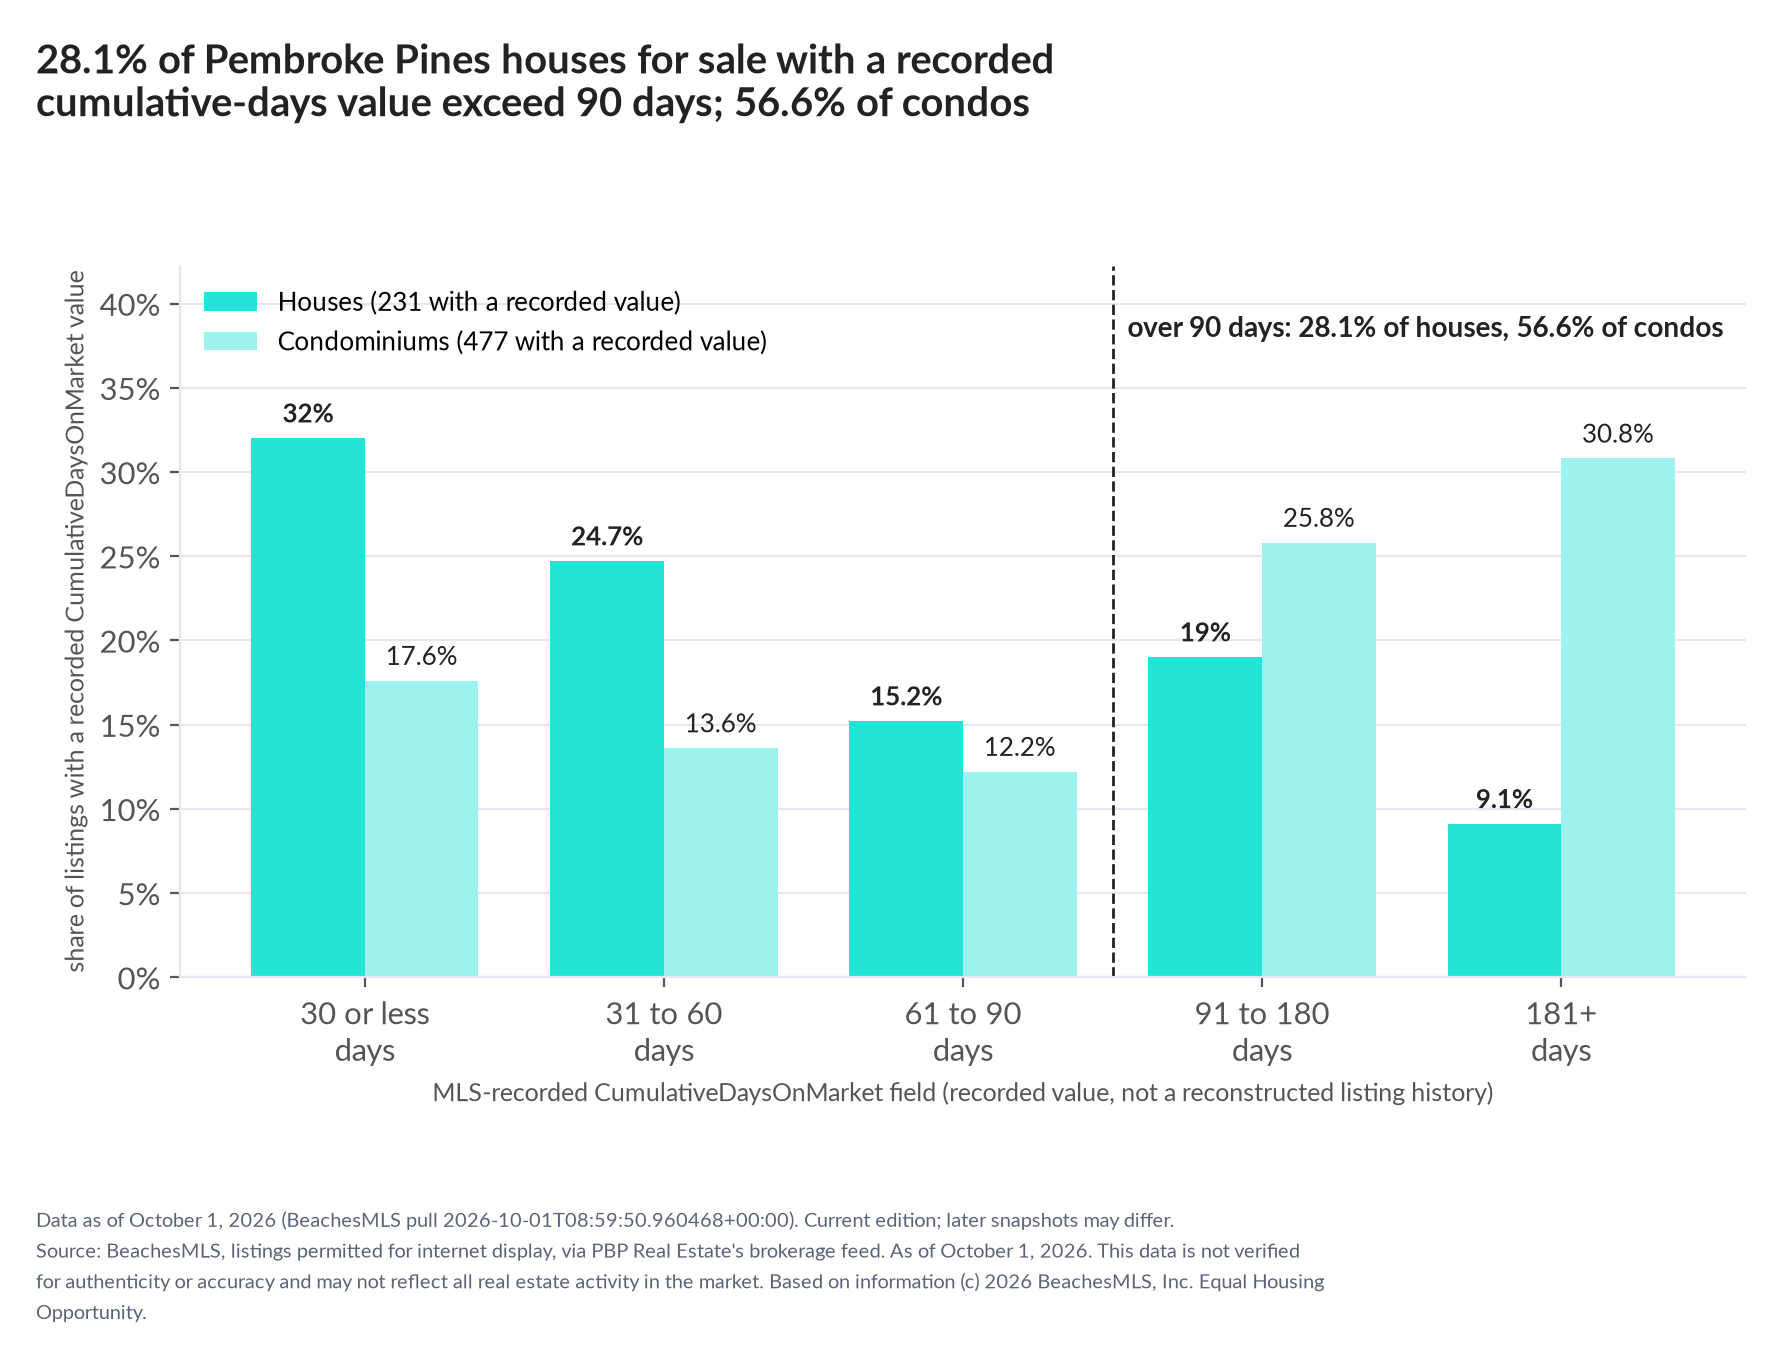
Active Pembroke Pines houses and condominiums by MLS-recorded CumulativeDaysOnMarket value, October 1, 2026. Shares use listings with a recorded value in that field; 28.1% of houses exceed 90 days. The field is not a reconstructed listing history. Source: BeachesMLS via PBP Real Estate. Download PNG
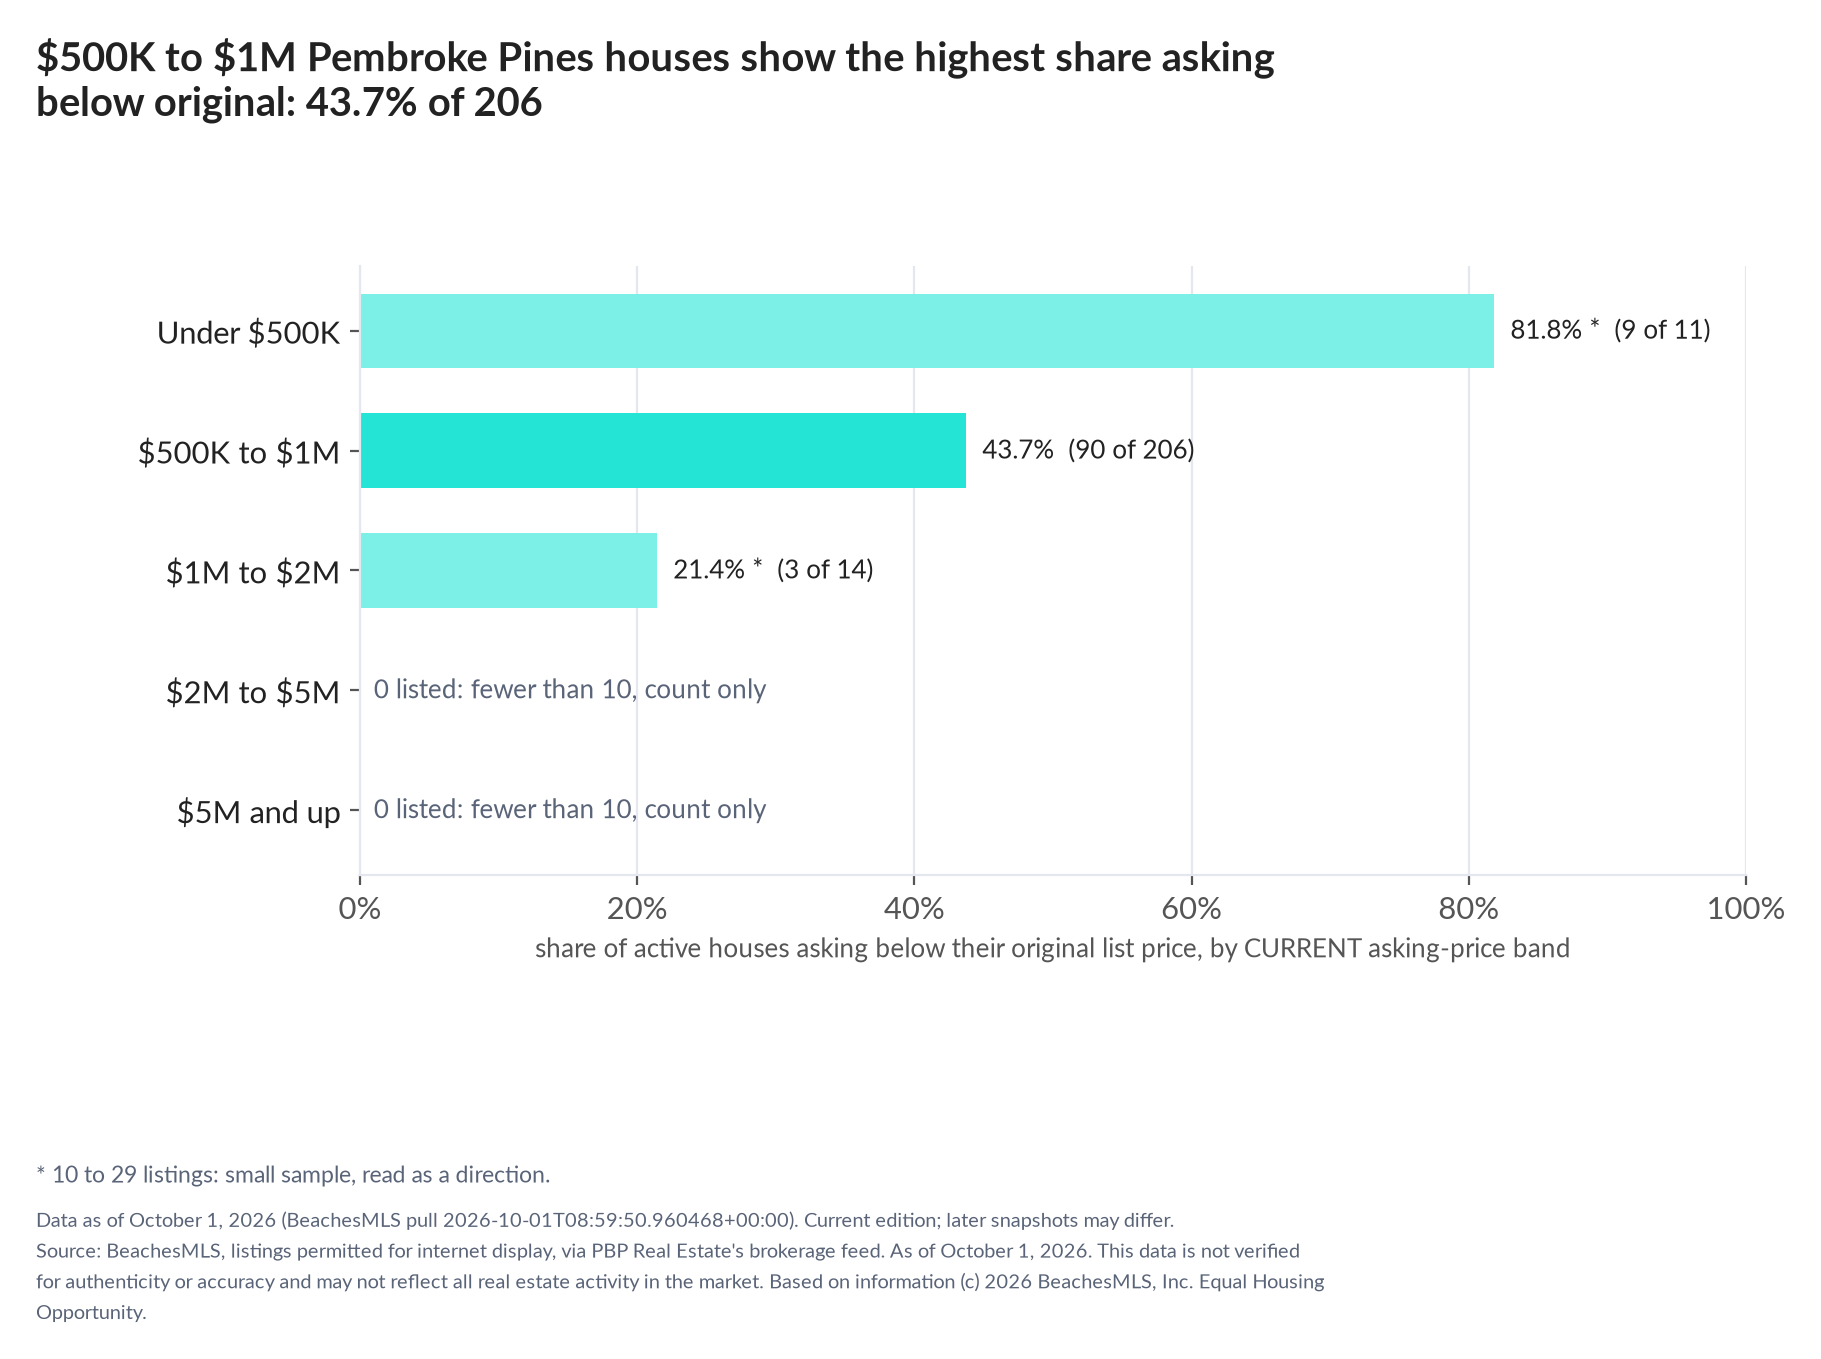
Share of active Pembroke Pines houses asking below their original list price, by current asking-price band, October 1, 2026. Bands with 10 to 29 listings marked small; under 10 show a count only. Source: BeachesMLS via PBP Real Estate. Download PNG
Downloads and methodology
Original journalist package: PDF. Method: Seller Blink Rate™ and recorded days on market.
Methodology as printed in this October 2026
Method, in plain English
Method, in plain English.
Source snapshot
What we counted: active and under-contract residential listings whose MLS City field is Pembroke Pines, permitted for internet display in PBP Real Estate's BeachesMLS data feed, in one snapshot pulled 2026-10-01 08:59:50 UTC (data as of October 1, 2026). The kit reports counts, medians, shares and comparisons calculated from recorded MLS fields; it does not estimate any property's value.
Current and original asking prices
Asking below original: a listing's current ListPrice is lower than its OriginalListPrice in that snapshot. This is a comparison of two recorded prices at this snapshot, not a price history; listings not below original may be unchanged, raised or missing a price (120 unchanged, 9 above original, 0 without both prices among houses). The median reduction is the middle value among reduced listings only, in percent and in dollars separately; it is reported when at least 10 listings are reduced.
Recorded days on market
Days on market: DaysOnMarket and CumulativeDaysOnMarket are reported as recorded in the MLS snapshot, each median over the listings with a value in that field; the over-90-day share and the distribution chart use listings with a recorded CumulativeDaysOnMarket value. These fields are not an independently reconstructed property history, do not verify whether or how often a property was relisted, and do not establish how any portal displays days on market.
Current asking-price bands
Price bands use the CURRENT asking price; shares within a band are percentages of that band's listings; bands with 10 to 29 listings are marked small and bands under 10 show a count only; a tie is declared at the reported precision.
Property classification
Segments follow the recorded tax legal description and the shared MLS classification rule: a listing whose legal description records a condominium is a condominium whatever its MLS subtype (townhouse, villa or single-family forms included); Condominium or Stock Cooperative subtypes stay in the condominium segment when the legal description is silent or records a parent parcel, including new-build units; Townhouse and Villa listings not classified as condominiums are reported in the HOA Fee Index and are outside both segments here; houses are the remaining SingleFamilyResidence listings. House and condominium statistics are never combined. These are analytical classifications of recorded fields, not a determination of any property's legal regime.
Under-contract sample
Under contract means Pending or Active Under Contract; under-contract percentages need at least 30 such listings, otherwise counts only.
Publication floor
Publication floor: 30 active listings in a segment; 30 to 39 is marked small. Sample sizes: 231 houses, 477 condominiums, 104 houses under contract.
Geographic scope
Geography is the MLS City field, not a verified municipal boundary. County comparisons use listings whose MLS record is in Broward County.
Seller Blink Rate definition
Seller Blink Rate™ is PBP Real Estate's name for the share of active listings asking below their original list price; it describes recorded asking prices, not seller intent or market health.
Peer comparisons
Conditions read: How the read works: the peer baseline is the median of published city shares in the same current median-asking-price tier, houses and condominiums separately. The lower-share label requires a below-original share at least 3 points under baseline and at least 65% of under-contract listings (minimum 10) not recorded as below original. That complement may include unchanged, raised or missing-price records; it is not a history measure. The higher-share label requires 3 or more points above baseline; other results are between the rule's thresholds. With fewer than four peer cities, the county is the baseline and can include the city. Samples of 30–39 active listings require caution. Snapshot comparison only, not speed, causality or a forecast.
Request the aggregate source table
Journalists may request the aggregate source table behind this kit (counts and medians by segment and band; no listing-level MLS records) from info@pbpre.com or 561-395-8418; nothing is gated.
Edition and revised source
Edition: Data as of October 1, 2026 (BeachesMLS pull 2026-10-01T08:59:50.960468+00:00). Current edition. A later snapshot may differ; this file describes only the date above. Cite this dated file for its figures. The monthly archive at https://www.pbprealestate.com/press/pembroke-pines/2026-10/ contains a separately dated edition; cite that page only for the figures shown in that edition. Later current data is at https://www.pbprealestate.com/price-cuts-pembroke-pines/.
Attribution and source limitations
Attribution: PBP Real Estate analysis of BeachesMLS listing data. This data is not verified for authenticity or accuracy and may not reflect all real estate activity in the market. Based on information (c) 2026 BeachesMLS, Inc. Equal Housing Opportunity.
Pembroke Pines condo fees, October 2026
Listings as of October 1, 2026. Live page with today's figures: Pembroke Pines condo fees. Every city: South Florida Condo Fee Index.
Headline options
- Pembroke Pines condo monthly association fees have a median of $683 in the retained usable-fee sample of 467 listings, 15% below the five-county median
- In Pembroke Pines's retained usable-fee sample (467 listings after exclusions and percentile trimming), 0.6% have monthly-equivalent fees of $1,000 or more and 27.4% are below $500
- Pembroke Pines's retained usable-fee sample (n=467): reported monthly-equivalent association fees range from $486 to $740 at the 25th to 75th percentiles
Lede
PEMBROKE PINES, Fla., October 1, 2026 - Among 467 active condominium listings in Pembroke Pines retained after excluding unusable-fee records and trimming monthly-equivalent fees below the city's 1st or above its 99th percentile, the median monthly association fee is $683, with the middle half between $486 and $740, according to PBP Real Estate's analysis of BeachesMLS listing data as of October 1, 2026. There are 477 active condominium listings before those exclusions and trimming; the fee statistics describe the retained sample, not every property for sale. The city median is 15% below the separately trimmed five-county median of $799 and ranks 42nd among 69 published city medians.
Quotable
"The median monthly-equivalent association fee in Pembroke Pines's retained usable-fee sample (n=467), after exclusions and percentile trimming, is $683, compared with $799 in the separately trimmed five-county sample."
"Among Pembroke Pines condos in the retained usable-fee sample (n=467) after exclusions and percentile trimming, 0.6 percent have listed monthly-equivalent fees of $1,000 or more and 27.4 percent are below $500."
"Among 467 retained listings with a current asking price of at least $20,000 in Pembroke Pines's usable-fee sample after exclusions and percentile trimming, a year of reported association fees equals a median 3.81 percent of the current asking price (median of per-listing ratios)."
Charts and source labels
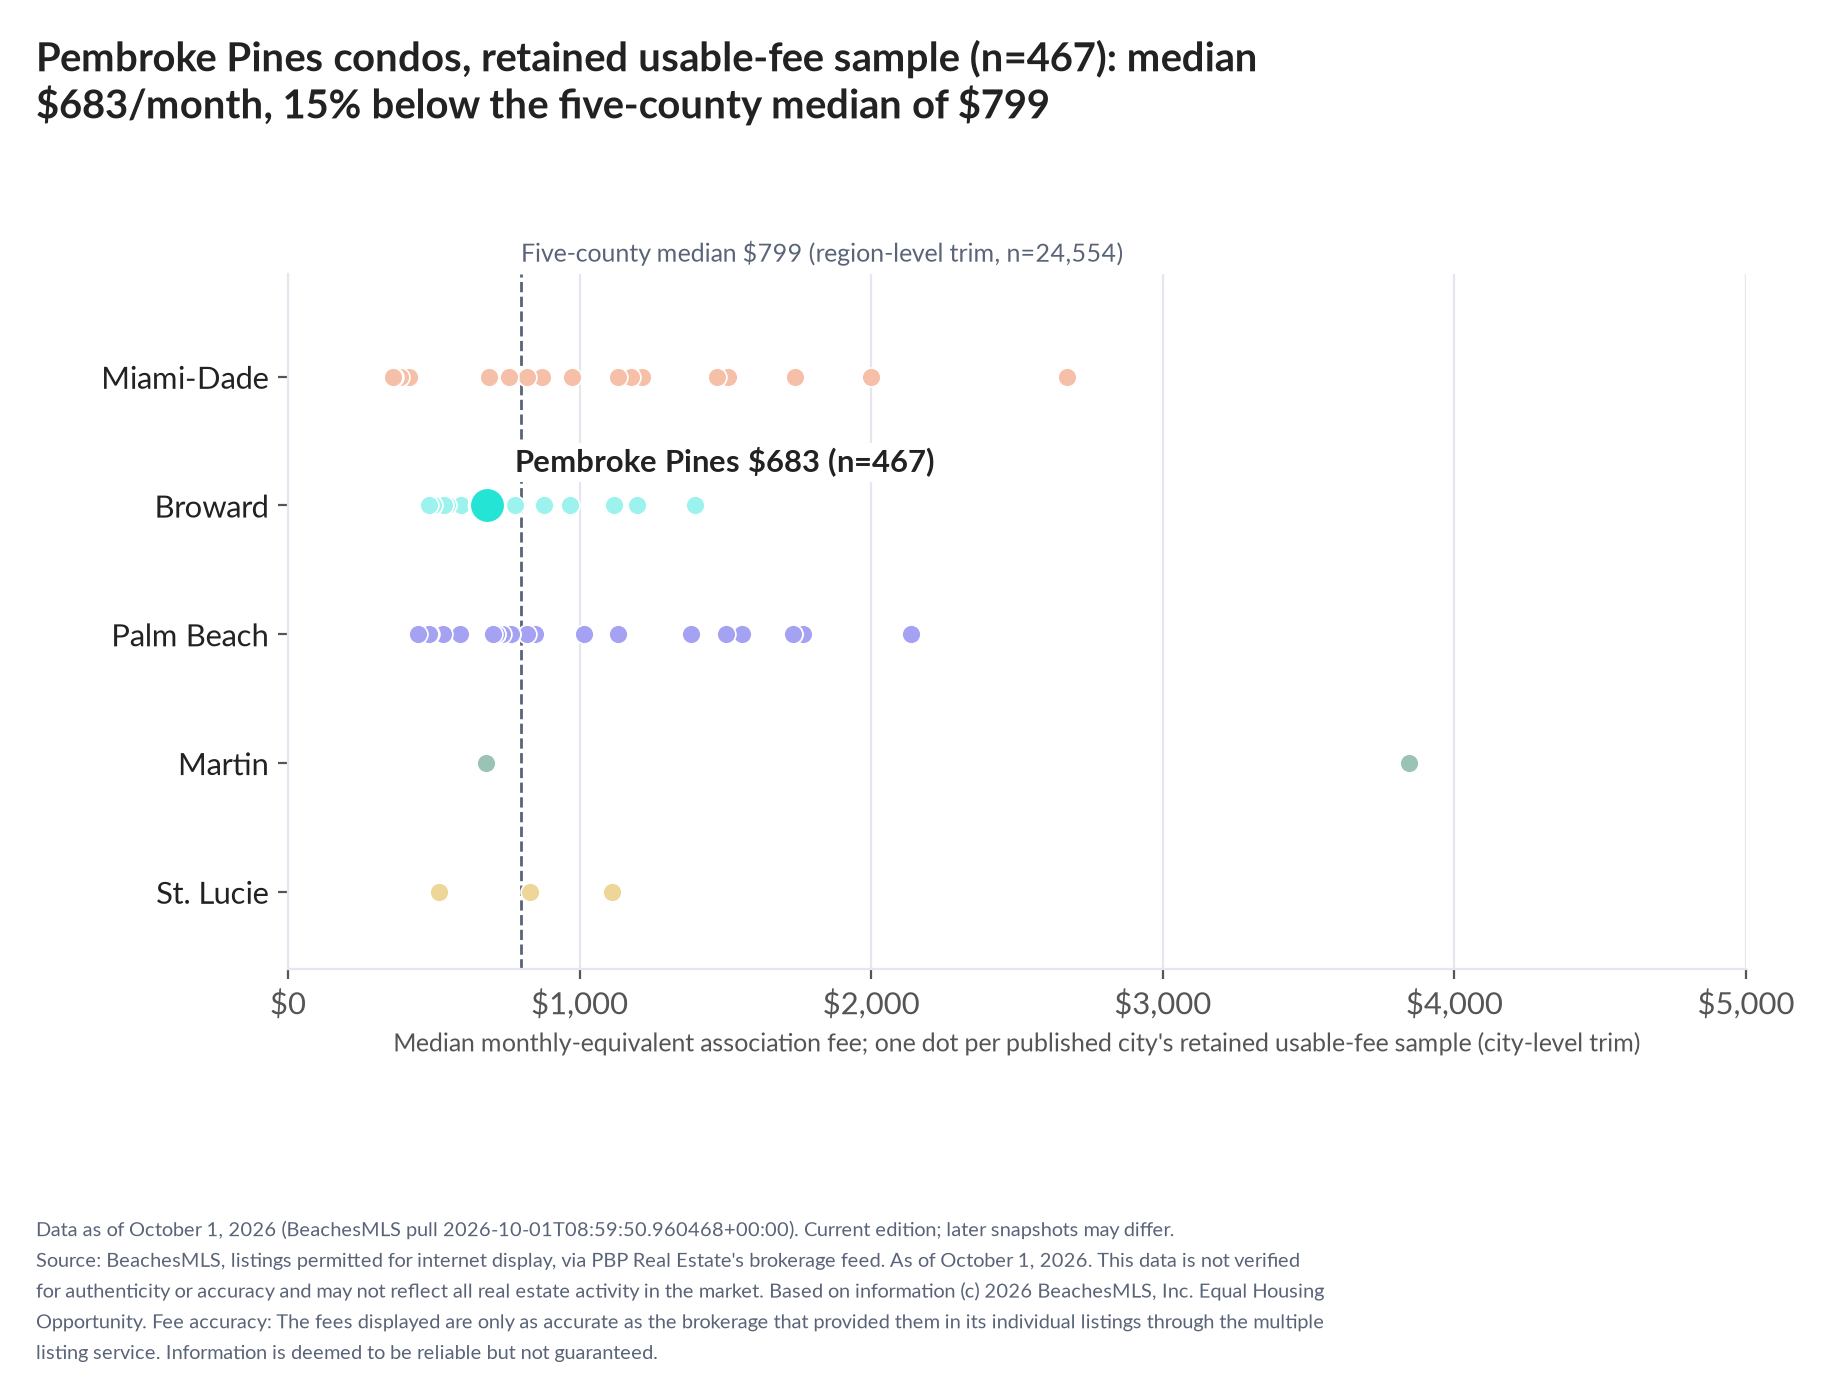
Median monthly-equivalent association fee in the retained usable-fee sample after exclusions and percentile trimming, Pembroke Pines and the published comparison cities, grouped by county, October 1, 2026. City medians use city-level trimming; the five-county reference uses a separate region-level trim and is not a median of city medians. A published city requires at least 30 listings with a valid fee before percentile trimming; the retained sample size is stated on the chart. Source: BeachesMLS via PBP Real Estate. Download PNG
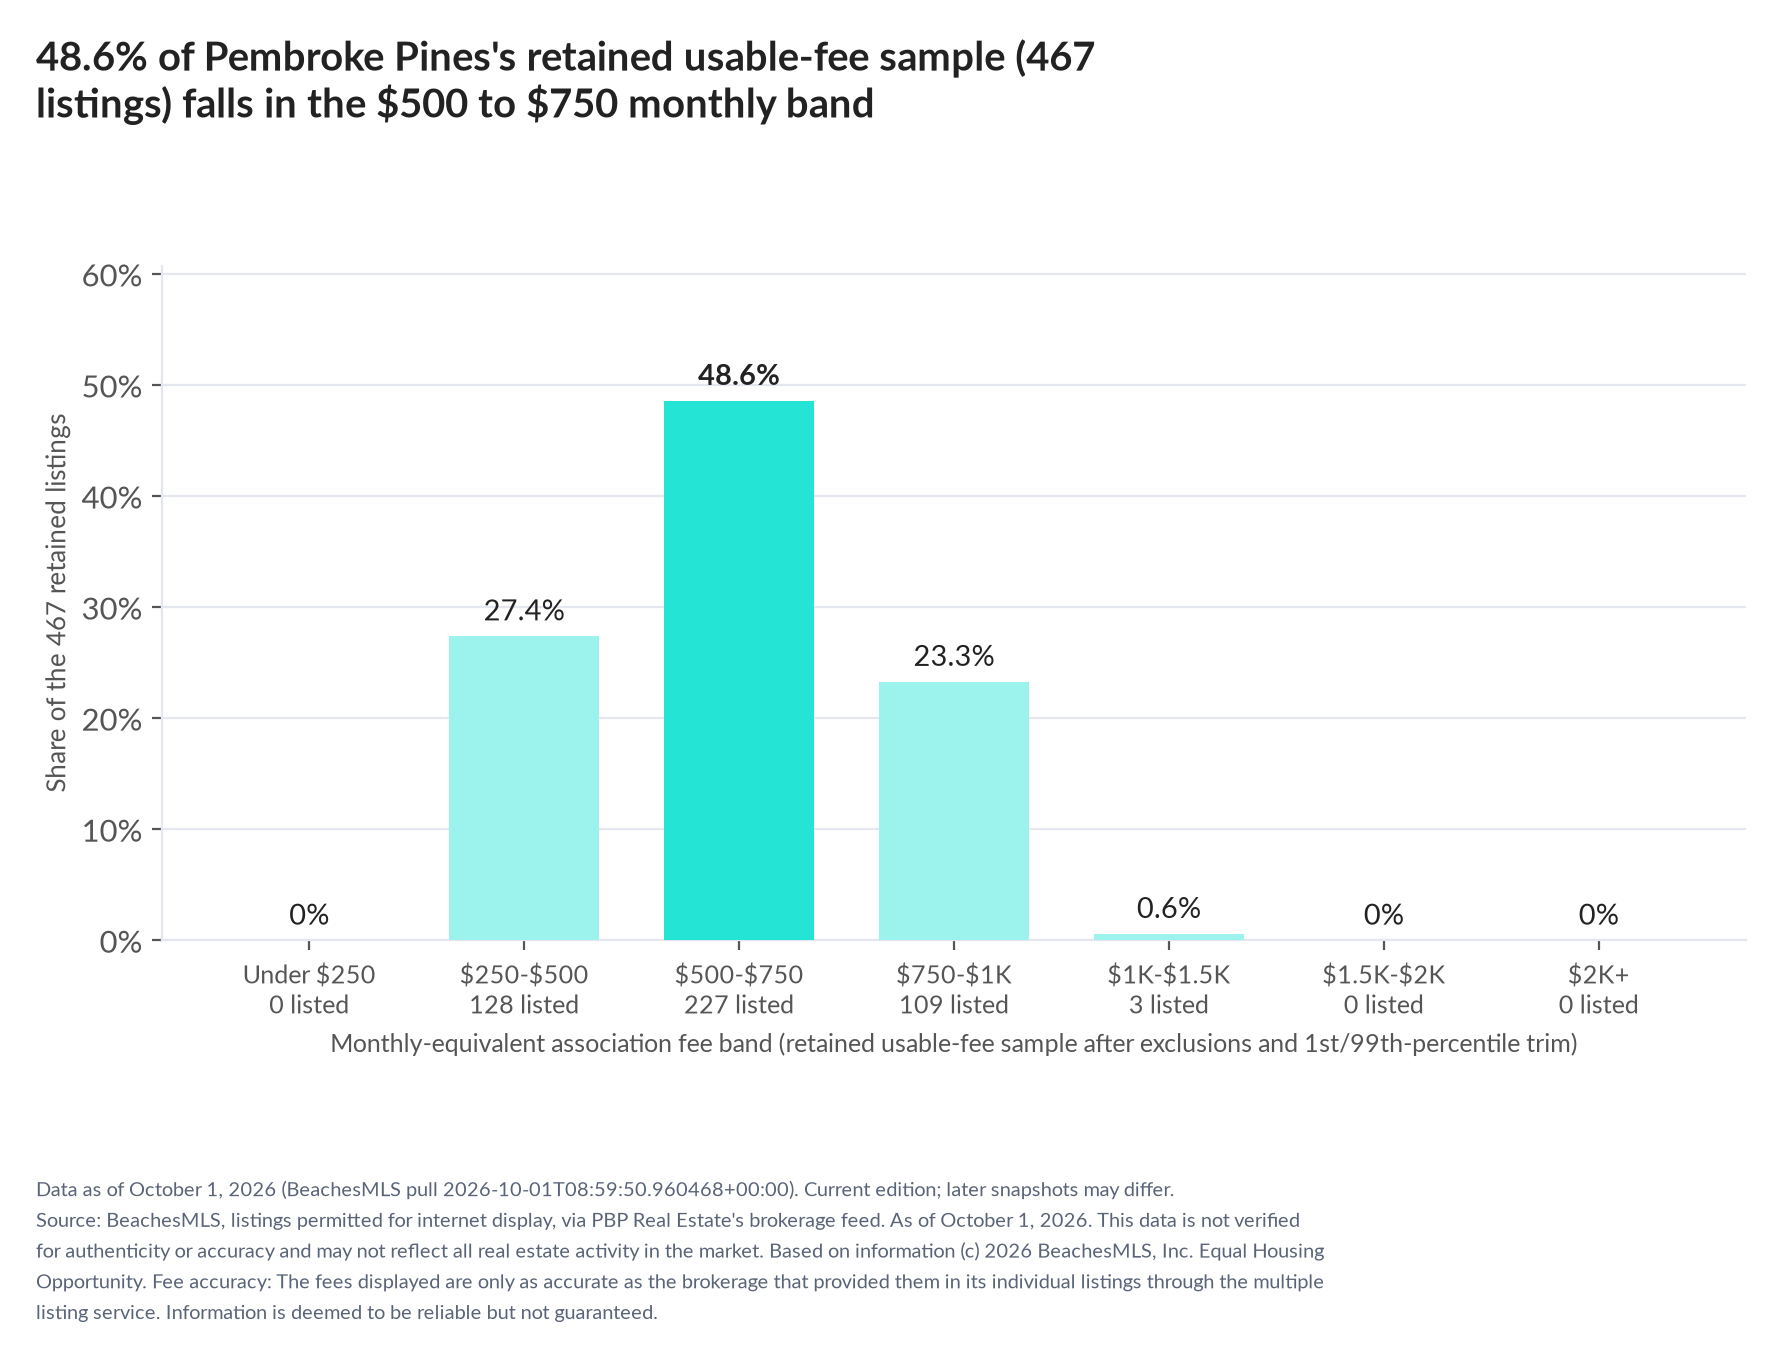
Monthly-equivalent association fee bands for the 467 active Pembroke Pines condominium listings retained after unusable-fee exclusions and city-level 1st/99th-percentile trimming, October 1, 2026. Shares describe this retained sample, not all active listings. Source: BeachesMLS via PBP Real Estate. Download PNG
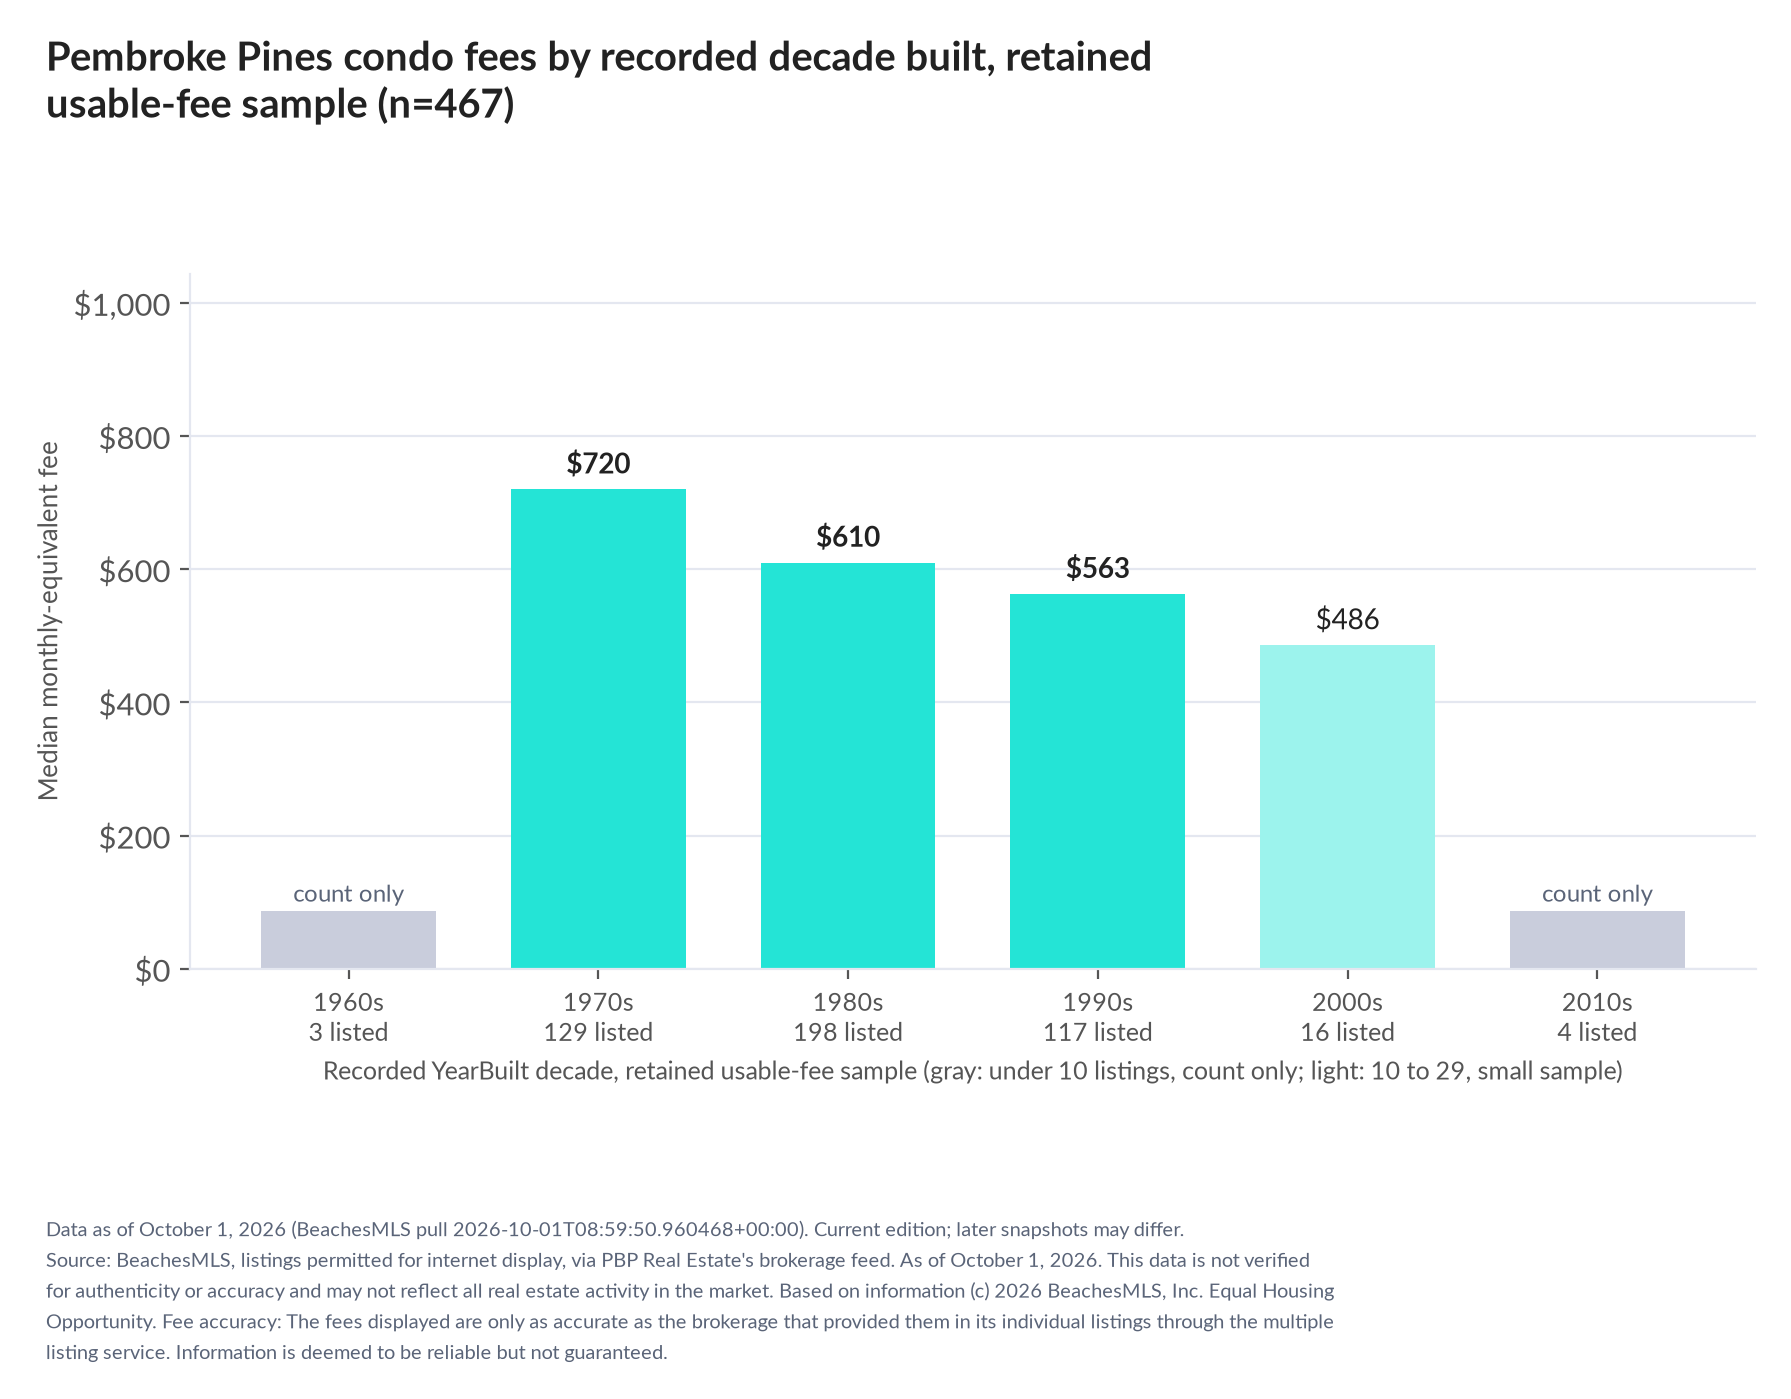
Median monthly-equivalent association fee by recorded YearBuilt decade among Pembroke Pines condominiums in the retained usable-fee sample after exclusions and percentile trimming, October 1, 2026. Each decade uses the retained records with a recorded construction year; decades under 10 listings shown gray with a count only. Source: BeachesMLS via PBP Real Estate. Download PNG
Downloads and methodology
Original journalist package: PDF. Method: South Florida Condo Fee Index.
Methodology as printed in this October 2026
Method, in plain English
Method, in plain English.
Source snapshot
What we counted: active condominium listings whose MLS City field is Pembroke Pines, permitted for internet display in PBP Real Estate's BeachesMLS data feed, in one snapshot pulled 2026-10-01 08:59:50 UTC (data as of October 1, 2026).
Monthly fee conversion
Fees are as entered by each listing office and converted to a monthly equivalent by the stated billing frequency (quarterly divided by three, semi-annual by six, annual by twelve); a listing with a fee but no stated frequency is excluded (0 in this snapshot). Where the MLS carries a second association fee, the two layers are summed and the second layer is reported separately.
Eligibility and retained fee sample
A city is published when at least 30 listings have a valid fee before trimming (477 here). Fees below the 1st or above the 99th percentile are excluded by the stated percentile rule (10 here); these records have not been independently verified as errors. This leaves the retained usable-fee sample of 467 listings; every fee median, percentile, band share and percentage in this kit describes that retained sample, not all 477 active listings.
Regional and county samples
Region and county comparisons are trimmed separately within their own samples (the five-county figure uses 24,554 retained listings); they are not the union of city-trimmed samples, and the five-county median is not a median of city medians. Per-square-foot fee ratios use retained listings with recorded living area of at least 300 square feet; annual-fee-to-asking-price ratios use retained listings with a current asking price of at least $20,000. Each is the median of per-listing ratios, with its own qualifying count stated. Measures by construction year use the recorded YearBuilt field; groups under 10 listings show a count only, and comparisons using a group of 10–29 listings carry a small-subgroup caution. Published city samples with fewer than 40 retained listings or fewer than 40 valid-fee listings before trimming are marked small; eligibility remains at least 30 valid-fee listings before trimming, so a retained sample may have fewer than 30.
Ranks and reported precision
Ranks compare published city medians at whole-dollar precision; equal medians tie.
Remarks-based indicators
Special assessment, membership and related shares are keyword classifications of agent-written public remarks and are not verified.
Property classification
Segments follow the recorded tax legal description and the shared MLS classification rule: a listing whose legal description records a condominium is a condominium whatever its MLS property subtype, including townhouse, villa or single-family forms. Condominium or Stock Cooperative subtypes stay in the condominium segment when the legal description is silent or records a parent parcel, including new-build units. Townhouse and Villa listings not classified as condominiums are reported together in the HOA Fee Index; houses are the remaining SingleFamilyResidence listings. These are analytical classifications of recorded fields, not a determination of any property's legal regime. This index reports the condominium segment. Nothing here is an opinion of value about any property or a statement about any specific association's finances.
Geographic scope
Geography is the MLS City field, not a verified municipal boundary. The fees displayed are only as accurate as the brokerage that provided them in its individual listings through the multiple listing service. Information is deemed to be reliable but not guaranteed.
Request the aggregate source table
Journalists may request the aggregate source table behind this kit (counts, medians and percentiles by city and band; no listing-level MLS records) from info@pbpre.com or 561-395-8418; nothing is gated.
Edition and revised source
Edition: Data as of October 1, 2026 (BeachesMLS pull 2026-10-01T08:59:50.960468+00:00). Current edition. A later snapshot may differ; this file describes only the date above. Cite this dated file for its figures. The monthly archive at https://www.pbprealestate.com/press/pembroke-pines/2026-10/ contains a separately dated edition; cite that page only for the figures shown in that edition. Later current data is at https://www.pbprealestate.com/condo-fees-pembroke-pines/.
Attribution and source limitations
Attribution: PBP Real Estate analysis of BeachesMLS listing data. This data is not verified for authenticity or accuracy and may not reflect all real estate activity in the market. Based on information (c) 2026 BeachesMLS, Inc. Equal Housing Opportunity.
Pembroke Pines HOA fees on townhouses and villas, October 2026
Listings as of October 1, 2026. Live page with today's figures: Pembroke Pines HOA fees. Every city: South Florida HOA Fee Index.
Headline options
- Pembroke Pines townhouse or villa monthly homeowners association fees have a median of $260 in the retained usable-fee sample of 83 listings, 15% below the five-county median
- In Pembroke Pines's retained usable-fee sample (83 listings after exclusions and percentile trimming), 1.2% have monthly-equivalent fees of $500 or more and 28.9% are below $200
- Pembroke Pines townhouses and villas, retained usable-fee sample: recorded YearBuilt 2005+ (n=25) vs pre-1995 (n=30), monthly median 59% higher. Small subgroup: 2005+; read cautiously.
Lede
PEMBROKE PINES, Fla., October 1, 2026 - Among 83 active townhouse or villa listings in Pembroke Pines retained after excluding unusable-fee records and trimming monthly-equivalent fees below the city's 1st or above its 99th percentile, the median monthly homeowners association fee is $260, with the middle half between $192 and $346, according to PBP Real Estate's analysis of BeachesMLS listing data as of October 1, 2026. There are 86 active townhouse or villa listings before those exclusions and trimming; the fee statistics describe the retained sample, not every property for sale. The city median is 15% below the separately trimmed five-county median of $307 and ranks tied 25th among 35 published city medians.
Quotable
"The median monthly-equivalent homeowners association fee in Pembroke Pines's retained usable-fee sample (n=83), after exclusions and percentile trimming, is $260, compared with $307 in the separately trimmed five-county sample."
"Among Pembroke Pines townhouses and villas in the retained usable-fee sample (n=83) after exclusions and percentile trimming, 1.2 percent have listed monthly-equivalent fees of $500 or more and 28.9 percent are below $200."
"Among the retained usable-fee listings in Pembroke Pines with a recorded construction year, the median monthly-equivalent fee is $331 for a recorded year built of 2005 or later (25 listings) and $208 for those built before 1995 (30 listings). Small subgroup: 2005+ n=25; read cautiously."
Charts and source labels
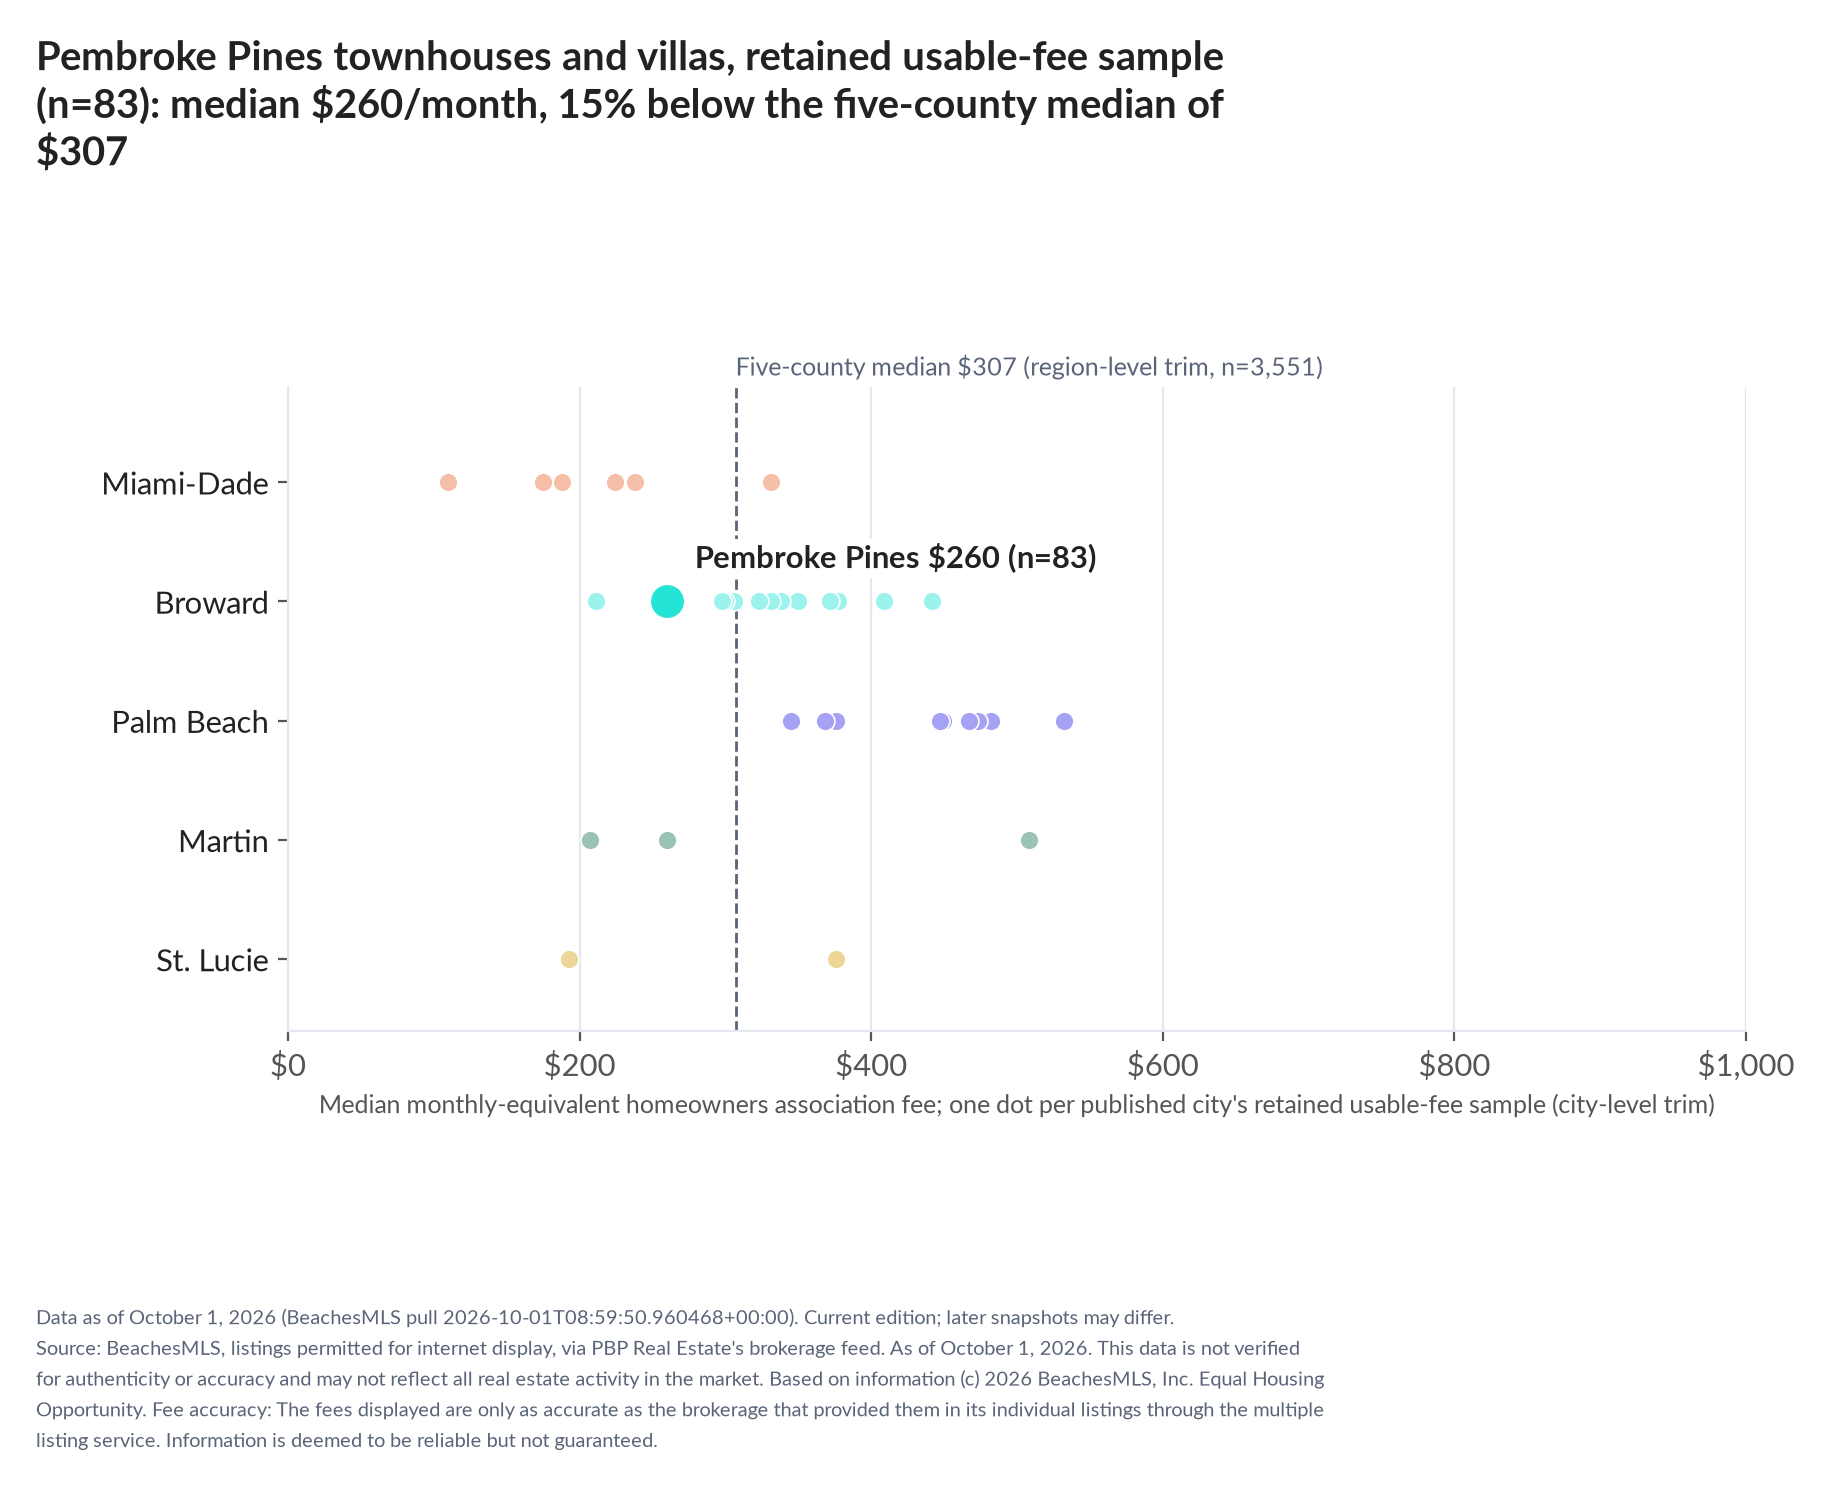
Median monthly-equivalent homeowners association fee in the retained usable-fee sample after exclusions and percentile trimming, Pembroke Pines and the published comparison cities, grouped by county, October 1, 2026. City medians use city-level trimming; the five-county reference uses a separate region-level trim and is not a median of city medians. A published city requires at least 30 listings with a valid fee before percentile trimming; the retained sample size is stated on the chart. Source: BeachesMLS via PBP Real Estate. Download PNG
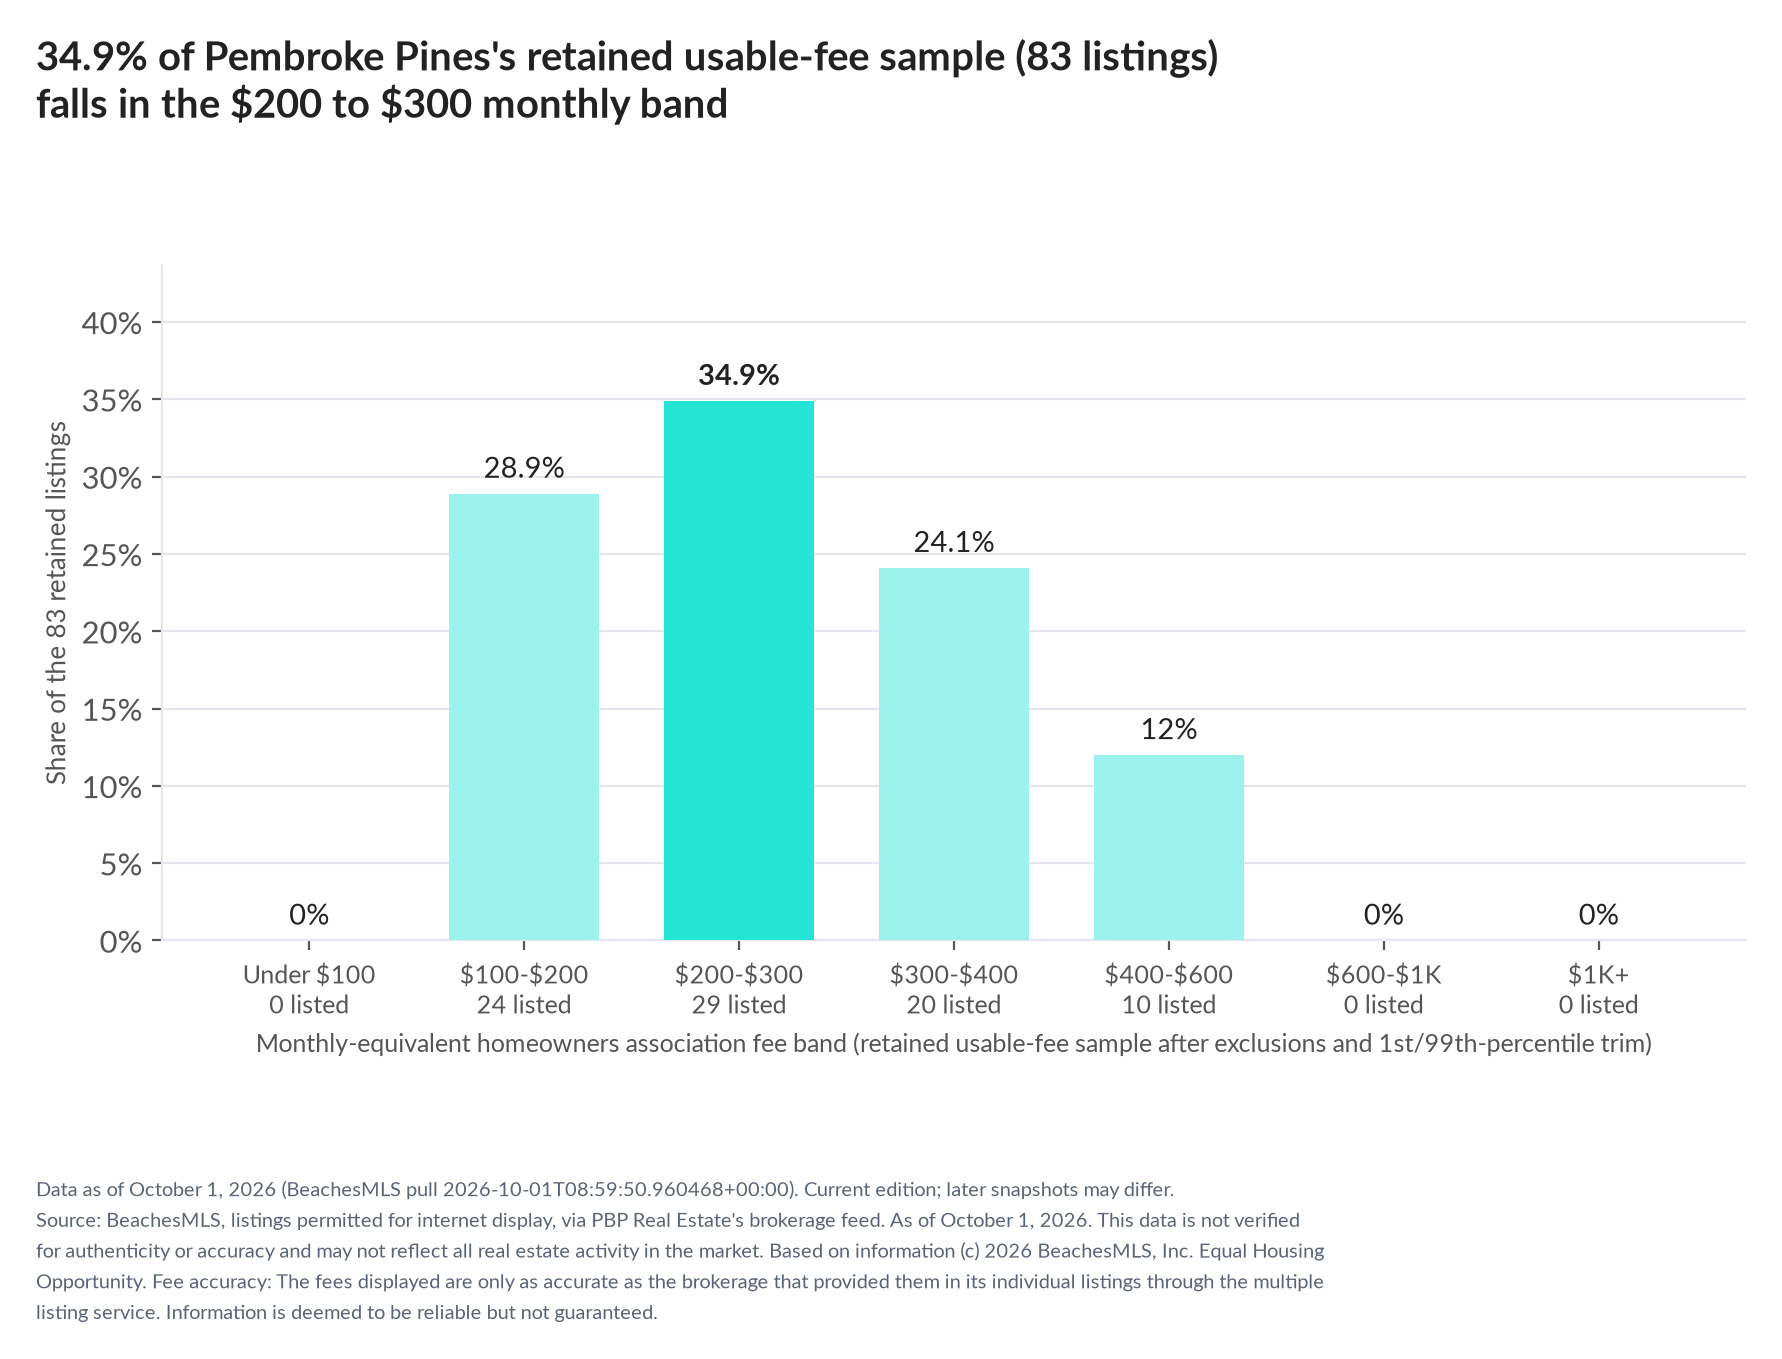
Monthly-equivalent homeowners association fee bands for the 83 active Pembroke Pines townhouse or villa listings retained after unusable-fee exclusions and city-level 1st/99th-percentile trimming, October 1, 2026. Shares describe this retained sample, not all active listings. Source: BeachesMLS via PBP Real Estate. Download PNG
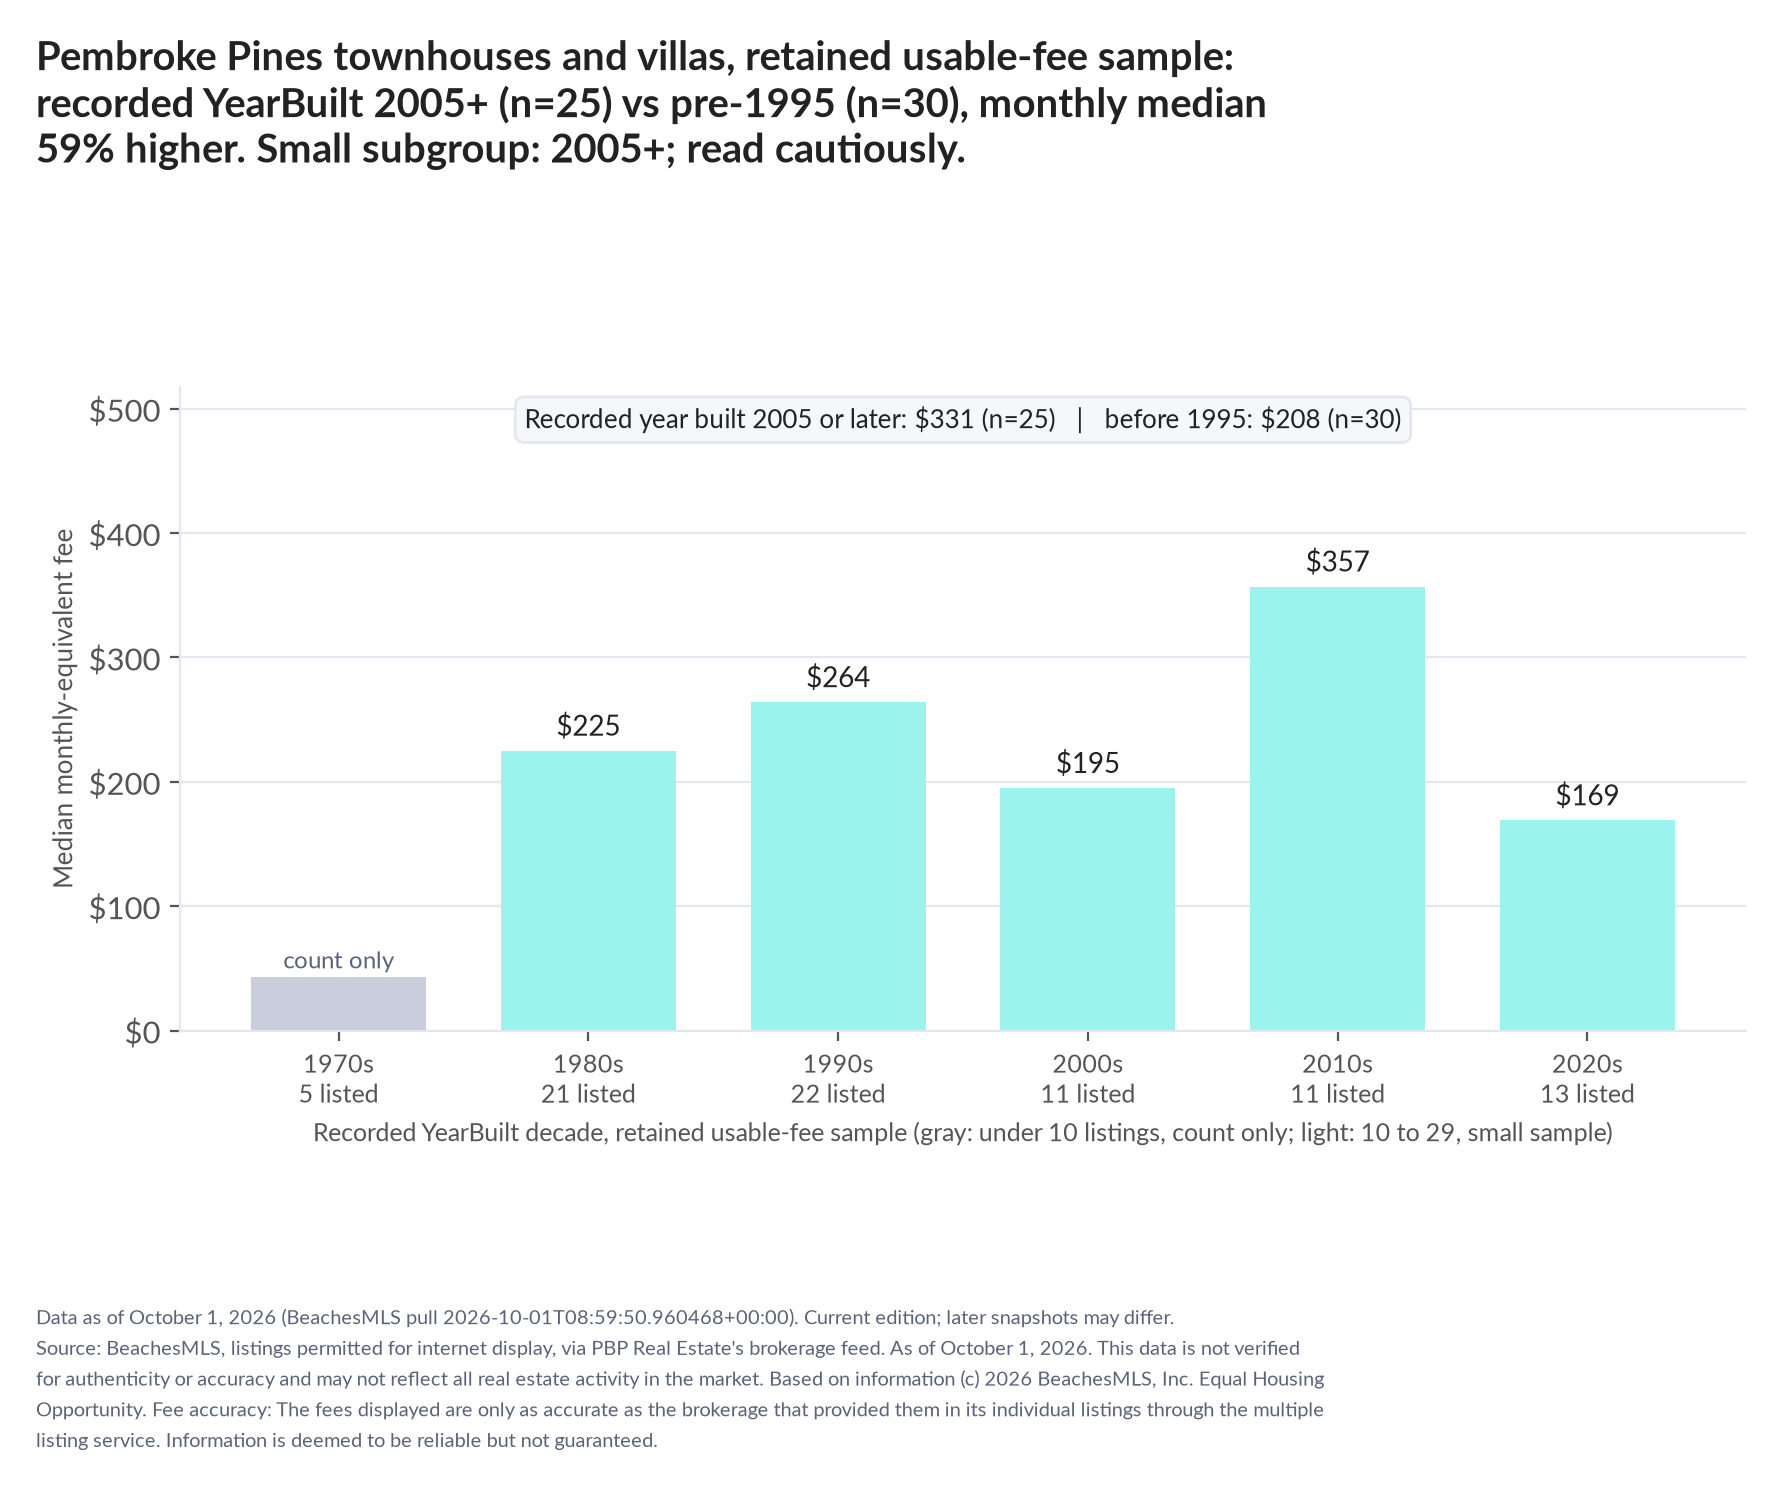
Median monthly-equivalent homeowners association fee by recorded YearBuilt decade among Pembroke Pines townhouses and villas in the retained usable-fee sample after exclusions and percentile trimming, October 1, 2026. Each decade uses the retained records with a recorded construction year; decades under 10 listings shown gray with a count only. Source: BeachesMLS via PBP Real Estate. Recorded YearBuilt 2005+ n=25; pre-1995 n=30. Small subgroup: 2005+ n=25; read cautiously. Download PNG
Downloads and methodology
Original journalist package: PDF. Method: South Florida Condo and HOA Fee Index.
Methodology as printed in this October 2026
Method, in plain English
Method, in plain English.
Source snapshot
What we counted: active townhouse or villa listings whose MLS City field is Pembroke Pines, permitted for internet display in PBP Real Estate's BeachesMLS data feed, in one snapshot pulled 2026-10-01 08:59:50 UTC (data as of October 1, 2026).
Monthly fee conversion
Fees are as entered by each listing office and converted to a monthly equivalent by the stated billing frequency (quarterly divided by three, semi-annual by six, annual by twelve); a listing with a fee but no stated frequency is excluded (1 in this snapshot). Where the MLS carries a second association fee, the two layers are summed and the second layer is reported separately.
Eligibility and retained fee sample
A city is published when at least 30 listings have a valid fee before trimming (85 here). Fees below the 1st or above the 99th percentile are excluded by the stated percentile rule (2 here); these records have not been independently verified as errors. This leaves the retained usable-fee sample of 83 listings; every fee median, percentile, band share and percentage in this kit describes that retained sample, not all 86 active listings.
Regional and county samples
Region and county comparisons are trimmed separately within their own samples (the five-county figure uses 3,551 retained listings); they are not the union of city-trimmed samples, and the five-county median is not a median of city medians. Per-square-foot fee ratios use retained listings with recorded living area of at least 300 square feet; annual-fee-to-asking-price ratios use retained listings with a current asking price of at least $20,000. Each is the median of per-listing ratios, with its own qualifying count stated. Measures by construction year use the recorded YearBuilt field; groups under 10 listings show a count only, and comparisons using a group of 10–29 listings carry a small-subgroup caution. Published city samples with fewer than 40 retained listings or fewer than 40 valid-fee listings before trimming are marked small; eligibility remains at least 30 valid-fee listings before trimming, so a retained sample may have fewer than 30.
Ranks and reported precision
Ranks compare published city medians at whole-dollar precision; equal medians tie.
Remarks-based indicators
Special assessment, membership and related shares are keyword classifications of agent-written public remarks and are not verified.
Property classification
Segments follow the recorded tax legal description and the shared MLS classification rule: a listing whose legal description records a condominium is a condominium whatever its MLS property subtype, including townhouse, villa or single-family forms. Condominium or Stock Cooperative subtypes stay in the condominium segment when the legal description is silent or records a parent parcel, including new-build units. Townhouse and Villa listings not classified as condominiums are reported together in the HOA Fee Index; houses are the remaining SingleFamilyResidence listings. These are analytical classifications of recorded fields, not a determination of any property's legal regime. This index reports the recorded Townhouse and Villa subtypes together after condominium classification. Nothing here is an opinion of value about any property or a statement about any specific association's finances.
Geographic scope
Geography is the MLS City field, not a verified municipal boundary. The fees displayed are only as accurate as the brokerage that provided them in its individual listings through the multiple listing service. Information is deemed to be reliable but not guaranteed.
Request the aggregate source table
Journalists may request the aggregate source table behind this kit (counts, medians and percentiles by city and band; no listing-level MLS records) from info@pbpre.com or 561-395-8418; nothing is gated.
Edition and revised source
Edition: Data as of October 1, 2026 (BeachesMLS pull 2026-10-01T08:59:50.960468+00:00). Current edition. A later snapshot may differ; this file describes only the date above. Cite this dated file for its figures. The monthly archive at https://www.pbprealestate.com/press/pembroke-pines/2026-10/ contains a separately dated edition; cite that page only for the figures shown in that edition. Later current data is at https://www.pbprealestate.com/hoa-fees-pembroke-pines/.
Attribution and source limitations
Attribution: PBP Real Estate analysis of BeachesMLS listing data. This data is not verified for authenticity or accuracy and may not reflect all real estate activity in the market. Based on information (c) 2026 BeachesMLS, Inc. Equal Housing Opportunity.
How to cite this edition
Use this dated archive URL and include the revision when citing figures or charts. Attribution:
PBP Real Estate analysis of BeachesMLS listing data, “Pembroke Pines housing data, October 2026,” listings as of October 1, 2026; original freeze 2026-10-01T09:21:26+00:00. https://www.pbprealestate.com/press/pembroke-pines/2026-10/
Questions about a correction or a licensed quote: Gia Freer, Broker of Record (Lic. BK689801), 561-395-8418 · info@pbpre.com.
Monthly editions and corrections: press archive. Current published city kits: press kits. Today's Pembroke Pines release: Pembroke Pines press release.
This data is not verified for authenticity or accuracy and may not reflect all real estate activity in the market. Based on information © 2026 BeachesMLS, Inc. Listings permitted for internet display. Nothing on this page is an opinion of value about any property. Equal Housing Opportunity.

All listings featuring the BMLS logo are provided by BeachesMLS, Inc. This information is not verified for authenticity or accuracy and is not guaranteed. Copyright © 2026 BeachesMLS, Inc.
IDX information is provided exclusively for consumers' personal, non-commercial use, and may not be used for any purpose other than to identify prospective properties consumers may be interested in purchasing. Data is deemed reliable but is not guaranteed accurate by the MLS. Data last updated October 1, 2026.