Press release · Aventura, Miami-Dade County · October 18, 2026
Aventura housing data press release, October 18, 2026
AVENTURA, Fla., October 18, 2026 - 42.8% of the 1,097 condominiums listed for sale in Aventura (469 listings) have a current asking price below their original list price, according to PBP Real Estate's analysis of BeachesMLS listing data as of October 18, 2026. Among those 469 reduced listings, the median reduction is 6.3% (about $30K). Houses: 19 for sale, below the 30-listing floor, so no percentages are reported for them.
This page carries the same text, figures and charts as today's Aventura press kit files, refreshed each day the data refreshes. Every figure is free to read and free to cite with attribution, with no sign-up. Dated monthly editions are kept in the press archive.
For the wider market beyond Aventura, read the Miami-Dade County housing market report.
Key takeaways
- 42.8% of the 1,097 condominiums listed for sale in Aventura (469 listings) have a current asking price below their original list price, according to PBP Real Estate's analysis of BeachesMLS listing data as of October 18, 2026.
- Among 1,074 active condominium listings in Aventura retained after excluding unusable-fee records and trimming monthly-equivalent fees below the city's 1st or above its 99th percentile, the median monthly association fee is $1,212, with the middle half between $968 and $1,747.
Aventura price cuts and days on market, October 18, 2026
Data as of October 18, 2026 (BeachesMLS pull 2026-10-18T10:02:49.950167+00:00) Live page with today's charts: Aventura price cuts and days on market. Every city: South Florida price cuts and days on market.
Headline options
- 42.8% of Aventura condominiums for sale are asking less than their original list price
- Seller Blink Rate™ in Aventura: 42.8% of condominiums list below original asking, against 38% across Miami-Dade County
- Buying in Aventura? 469 of the 1,097 condominiums for sale are asking below their original price, by a median $30K
Lede
AVENTURA, Fla., October 18, 2026 - 42.8% of the 1,097 condominiums listed for sale in Aventura (469 listings) have a current asking price below their original list price, according to PBP Real Estate's analysis of BeachesMLS listing data as of October 18, 2026. Among those 469 reduced listings, the median reduction is 6.3% (about $30K). Houses: 19 for sale, below the 30-listing floor, so no percentages are reported for them.
Quotable
"42.8 percent of condominiums for sale in Aventura have a current asking price below their original list price; among those 469 reduced listings the median reduction is $30K."
"Among active Aventura condominiums, the median recorded CumulativeDaysOnMarket and DaysOnMarket values are both 128 days. These are MLS-recorded fields, not an independently reconstructed listing history."
"At the snapshot, 53.2 percent of the 94 Aventura condominiums under contract had a recorded asking price below their original list price; the median reduction among that group was 9.6 percent. The remainder were not recorded as below their original list price, which is not a price history. Agreed contract prices are not inferred from these asking prices."
Charts and source labels
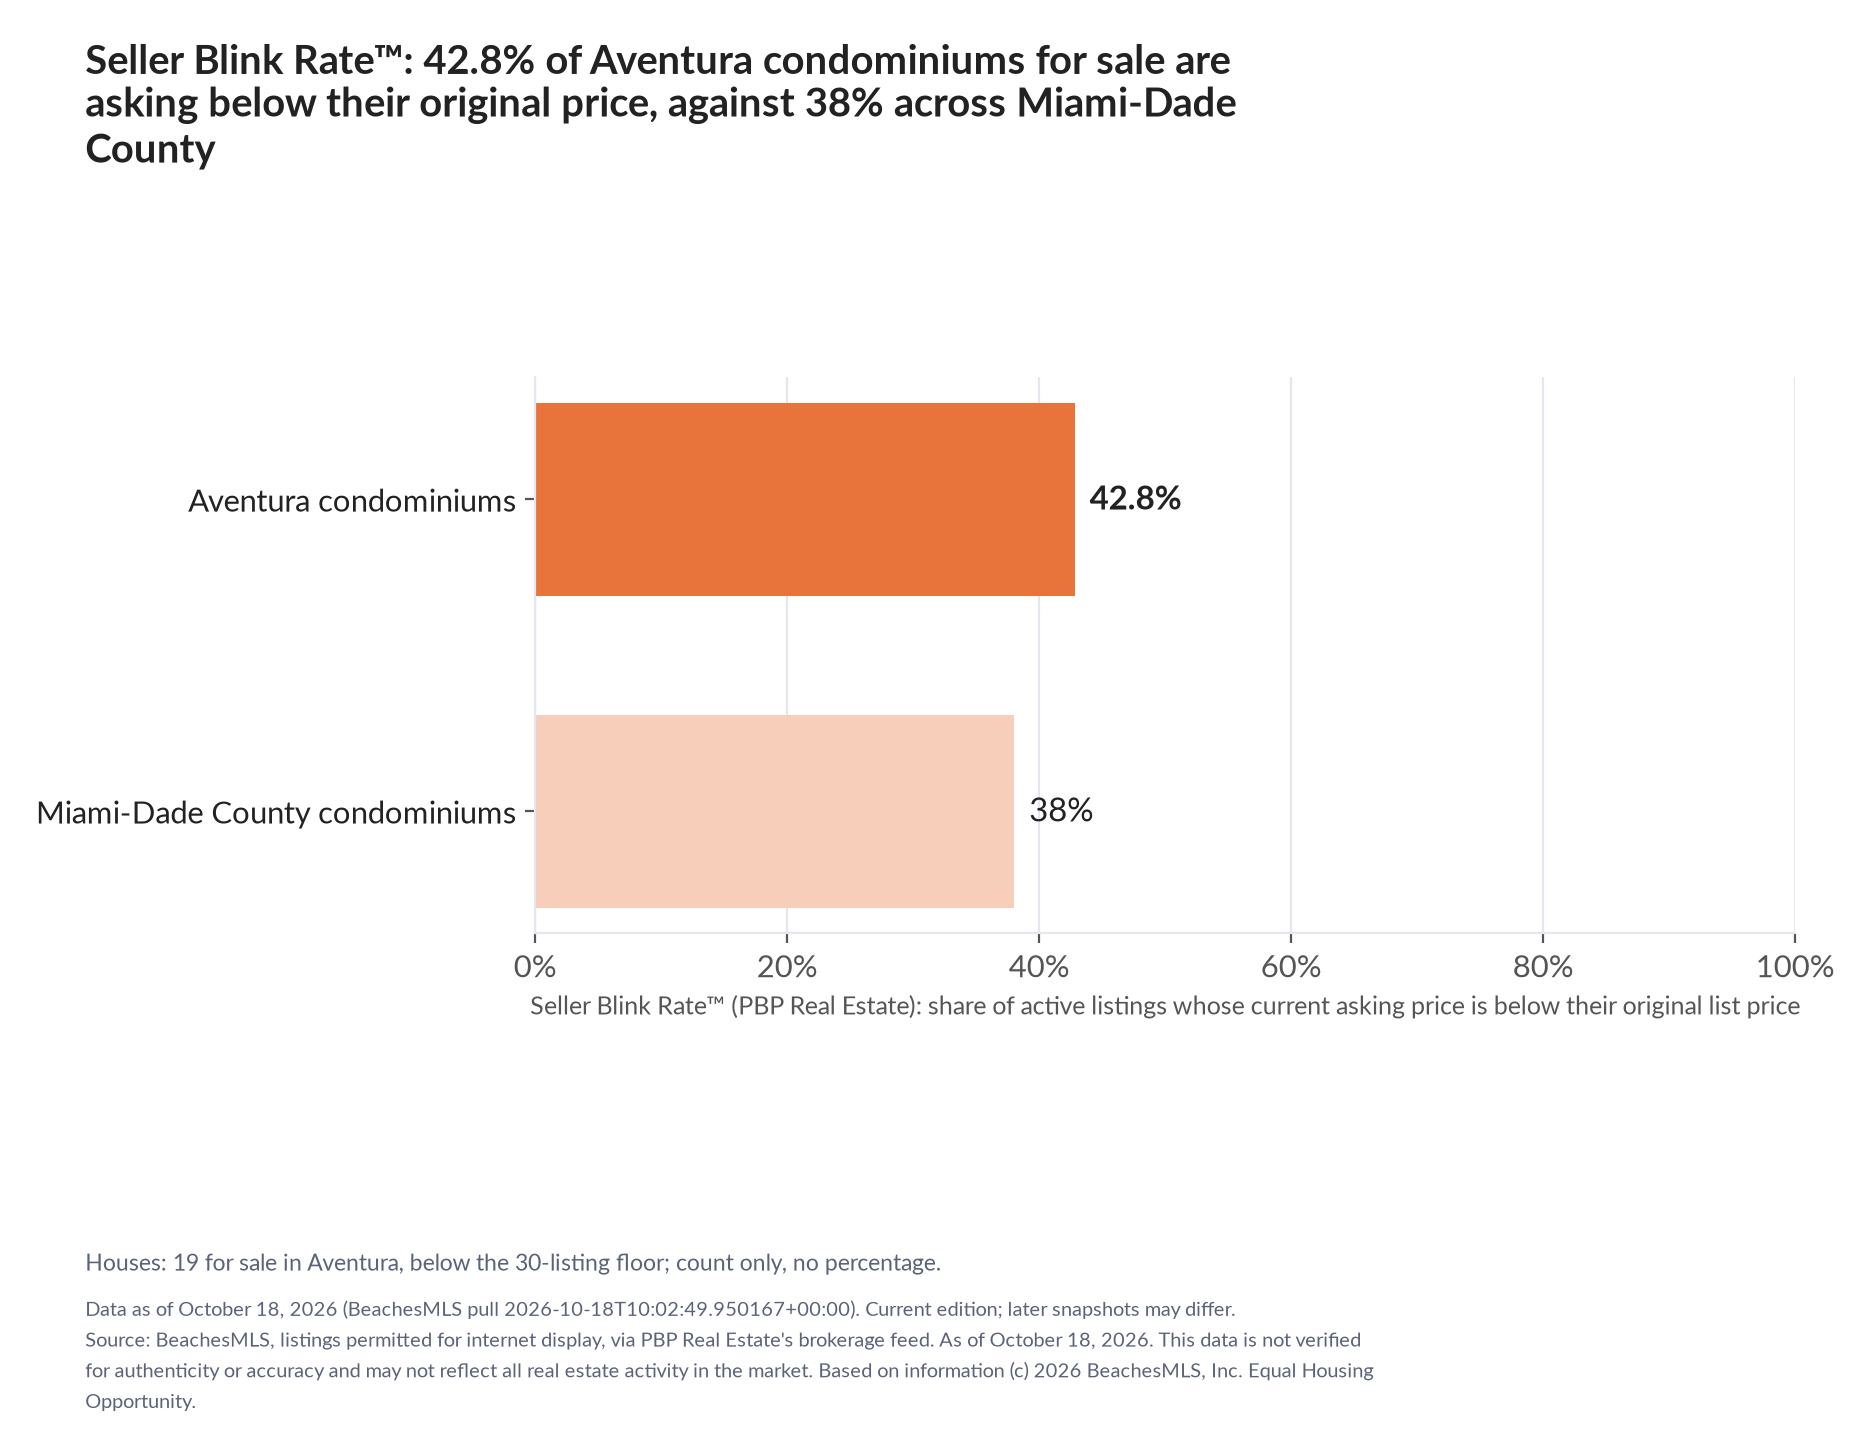
Seller Blink Rate™: share of active listings whose current asking price is below their original list price, Aventura versus Miami-Dade County, condominiums, October 18, 2026. Not a price history. Source: BeachesMLS via PBP Real Estate. Download PNG
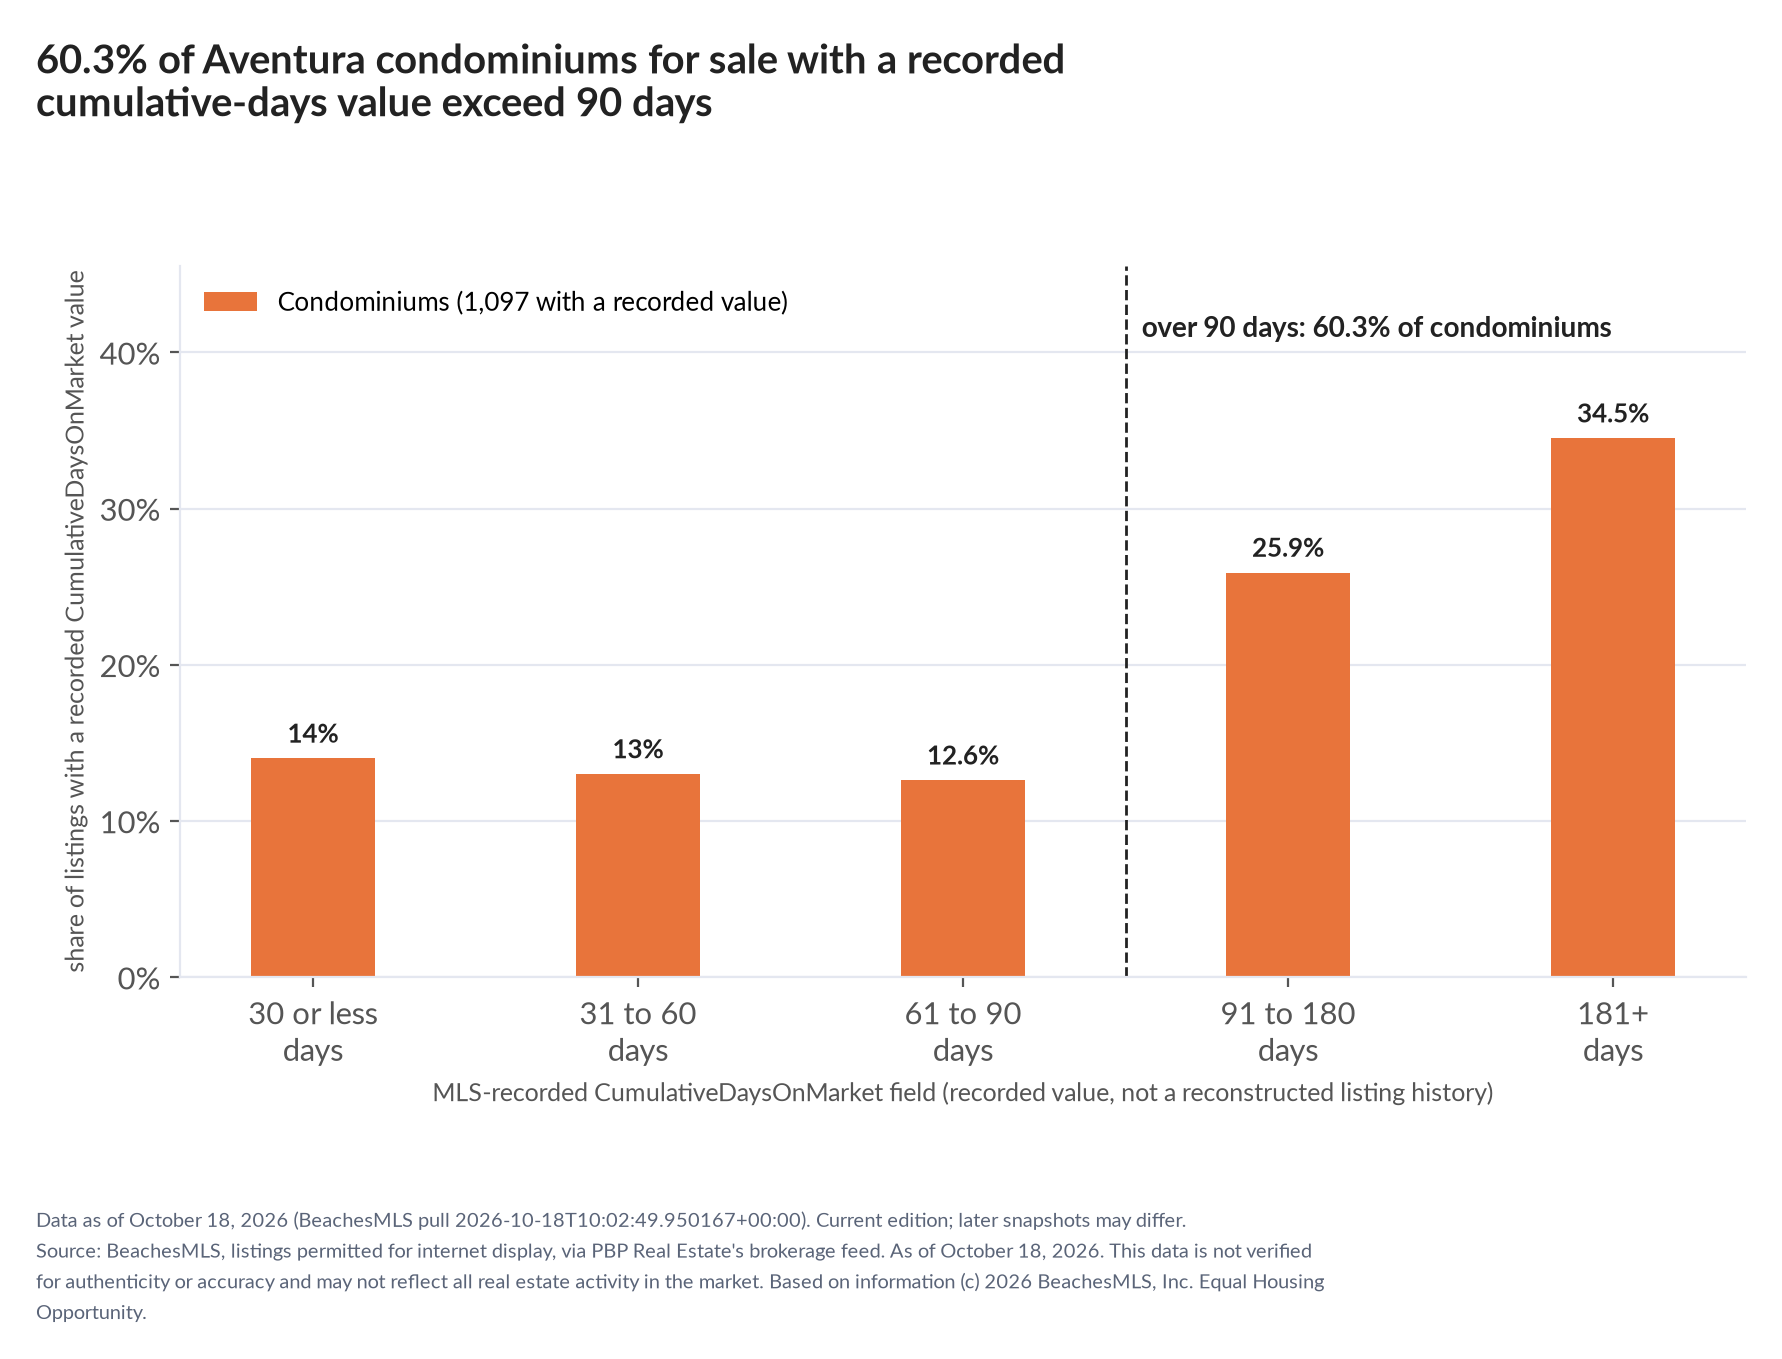
Active Aventura condominiums by MLS-recorded CumulativeDaysOnMarket value, October 18, 2026. Shares use listings with a recorded value in that field; 60.3% of condominiums exceed 90 days. The field is not a reconstructed listing history. Source: BeachesMLS via PBP Real Estate. Download PNG
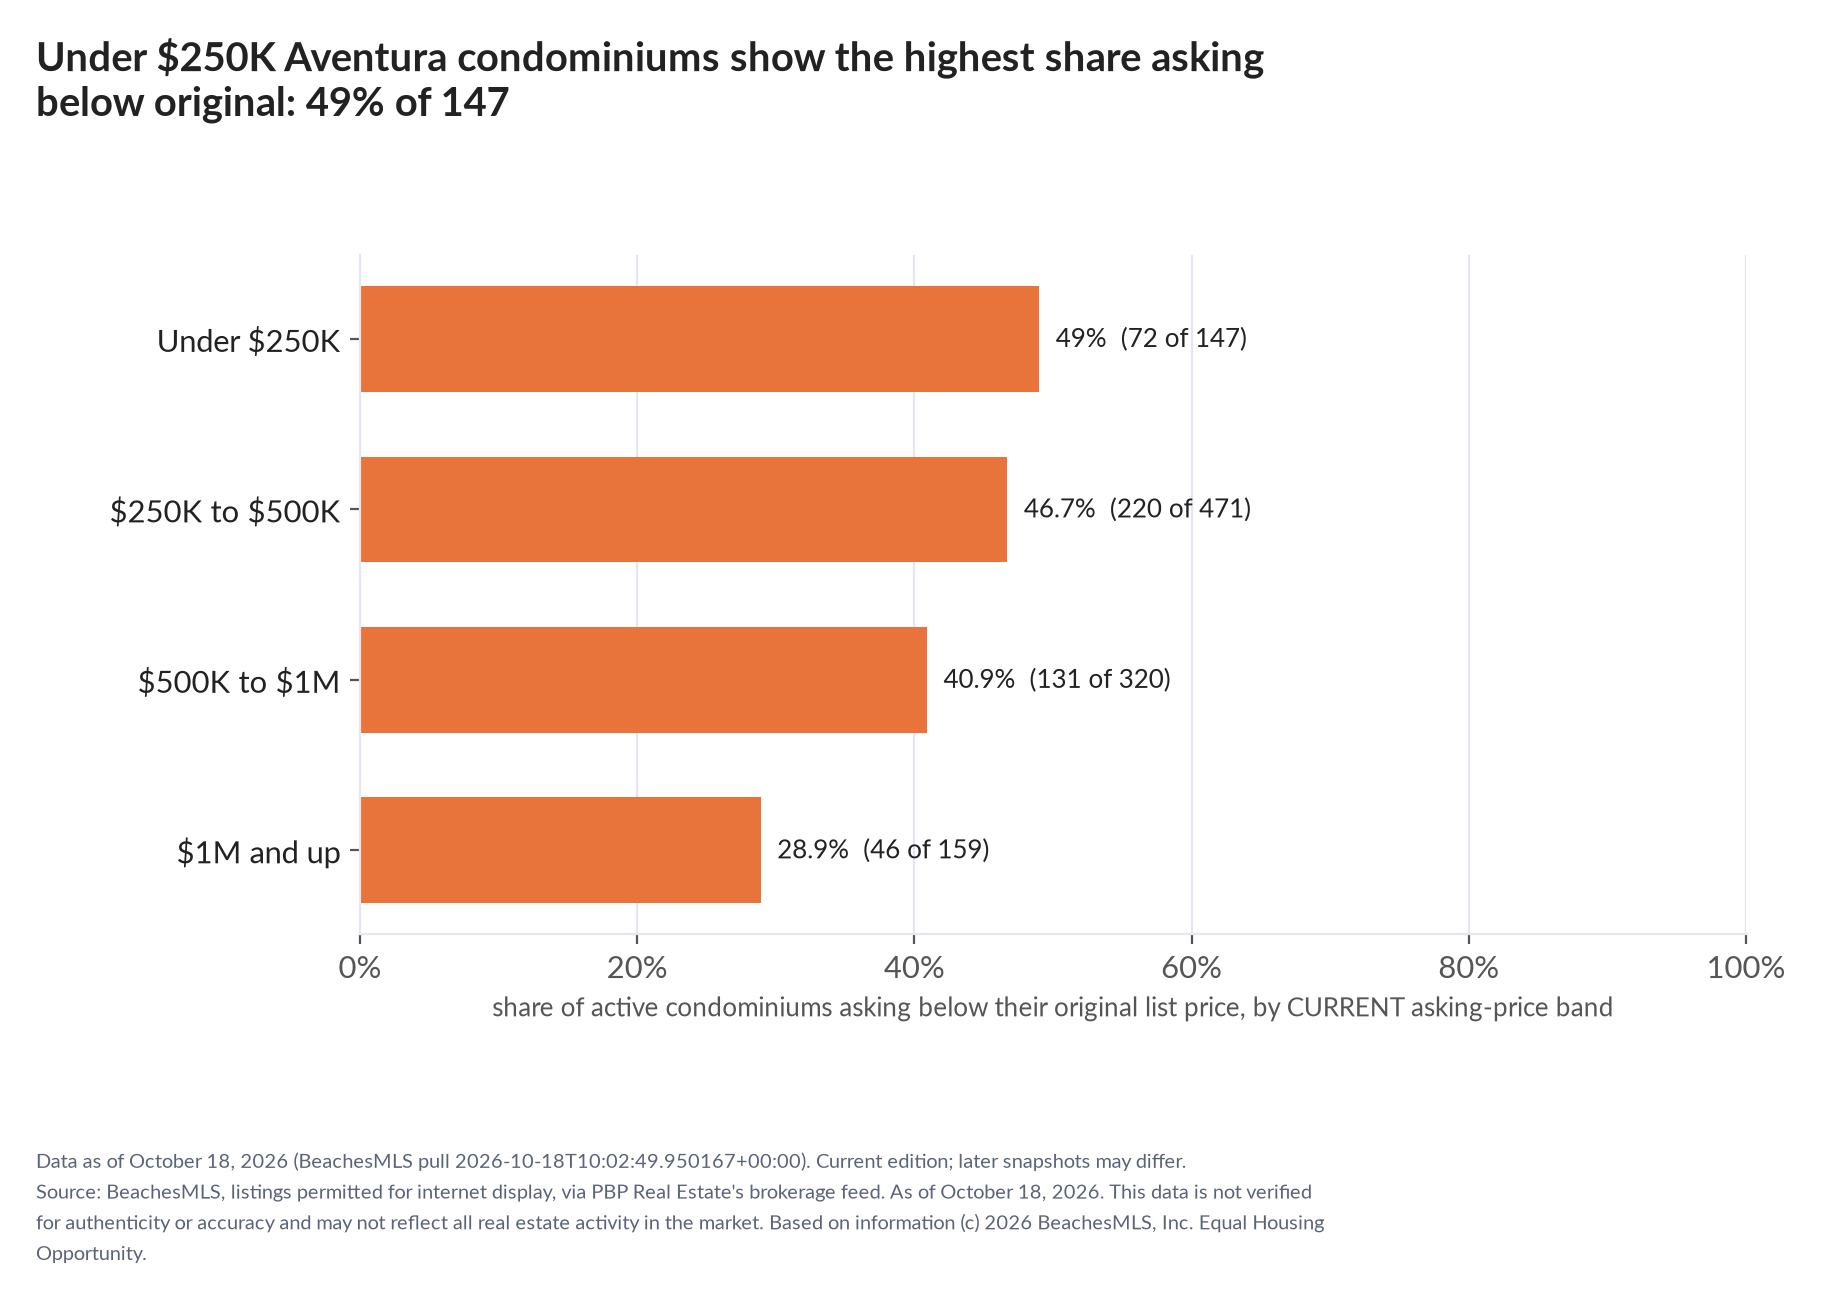
Share of active Aventura condominiums asking below their original list price, by current asking-price band, October 18, 2026. Bands with 10 to 29 listings marked small; under 10 show a count only. Source: BeachesMLS via PBP Real Estate. Download PNG
Downloads and methodology
Journalist package: PDF · Plain text · ZIP with charts. Method: Seller Blink Rate™ method. Current edition. A later snapshot may differ; this file describes only the date above.
Aventura condominium association fees, October 18, 2026
Data as of October 18, 2026 (BeachesMLS pull 2026-10-18T10:02:49.950167+00:00) Live page with today's charts: Aventura condo fees. Every city: South Florida Condo Fee Index.
Headline options
- Aventura condo monthly association fees have a median of $1,212 in the retained usable-fee sample of 1,074 listings, 51% above the five-county median
- In Aventura's retained usable-fee sample (1,074 listings after exclusions and percentile trimming), 70.9% have monthly-equivalent fees of $1,000 or more and 2.6% are below $500
- Aventura condos, retained usable-fee sample: recorded YearBuilt 2005+ (n=218) vs pre-1995 (n=695), monthly median 48% higher
Lede
AVENTURA, Fla., October 18, 2026 - Among 1,074 active condominium listings in Aventura retained after excluding unusable-fee records and trimming monthly-equivalent fees below the city's 1st or above its 99th percentile, the median monthly association fee is $1,212, with the middle half between $968 and $1,747, according to PBP Real Estate's analysis of BeachesMLS listing data as of October 18, 2026. There are 1,097 active condominium listings before those exclusions and trimming; the fee statistics describe the retained sample, not every property for sale. The city median is 51% above the separately trimmed five-county median of $800 and ranks 15th among 69 published city medians.
Quotable
"The median monthly-equivalent association fee in Aventura's retained usable-fee sample (n=1,074), after exclusions and percentile trimming, is $1,212, compared with $800 in the separately trimmed five-county sample."
"Among Aventura condos in the retained usable-fee sample (n=1,074) after exclusions and percentile trimming, 70.9 percent have listed monthly-equivalent fees of $1,000 or more and 2.6 percent are below $500."
"Among the retained usable-fee listings in Aventura with a recorded construction year, the median monthly-equivalent fee is $1,620 for a recorded year built of 2005 or later (218 listings) and $1,094 for those built before 1995 (695 listings)."
Charts and source labels
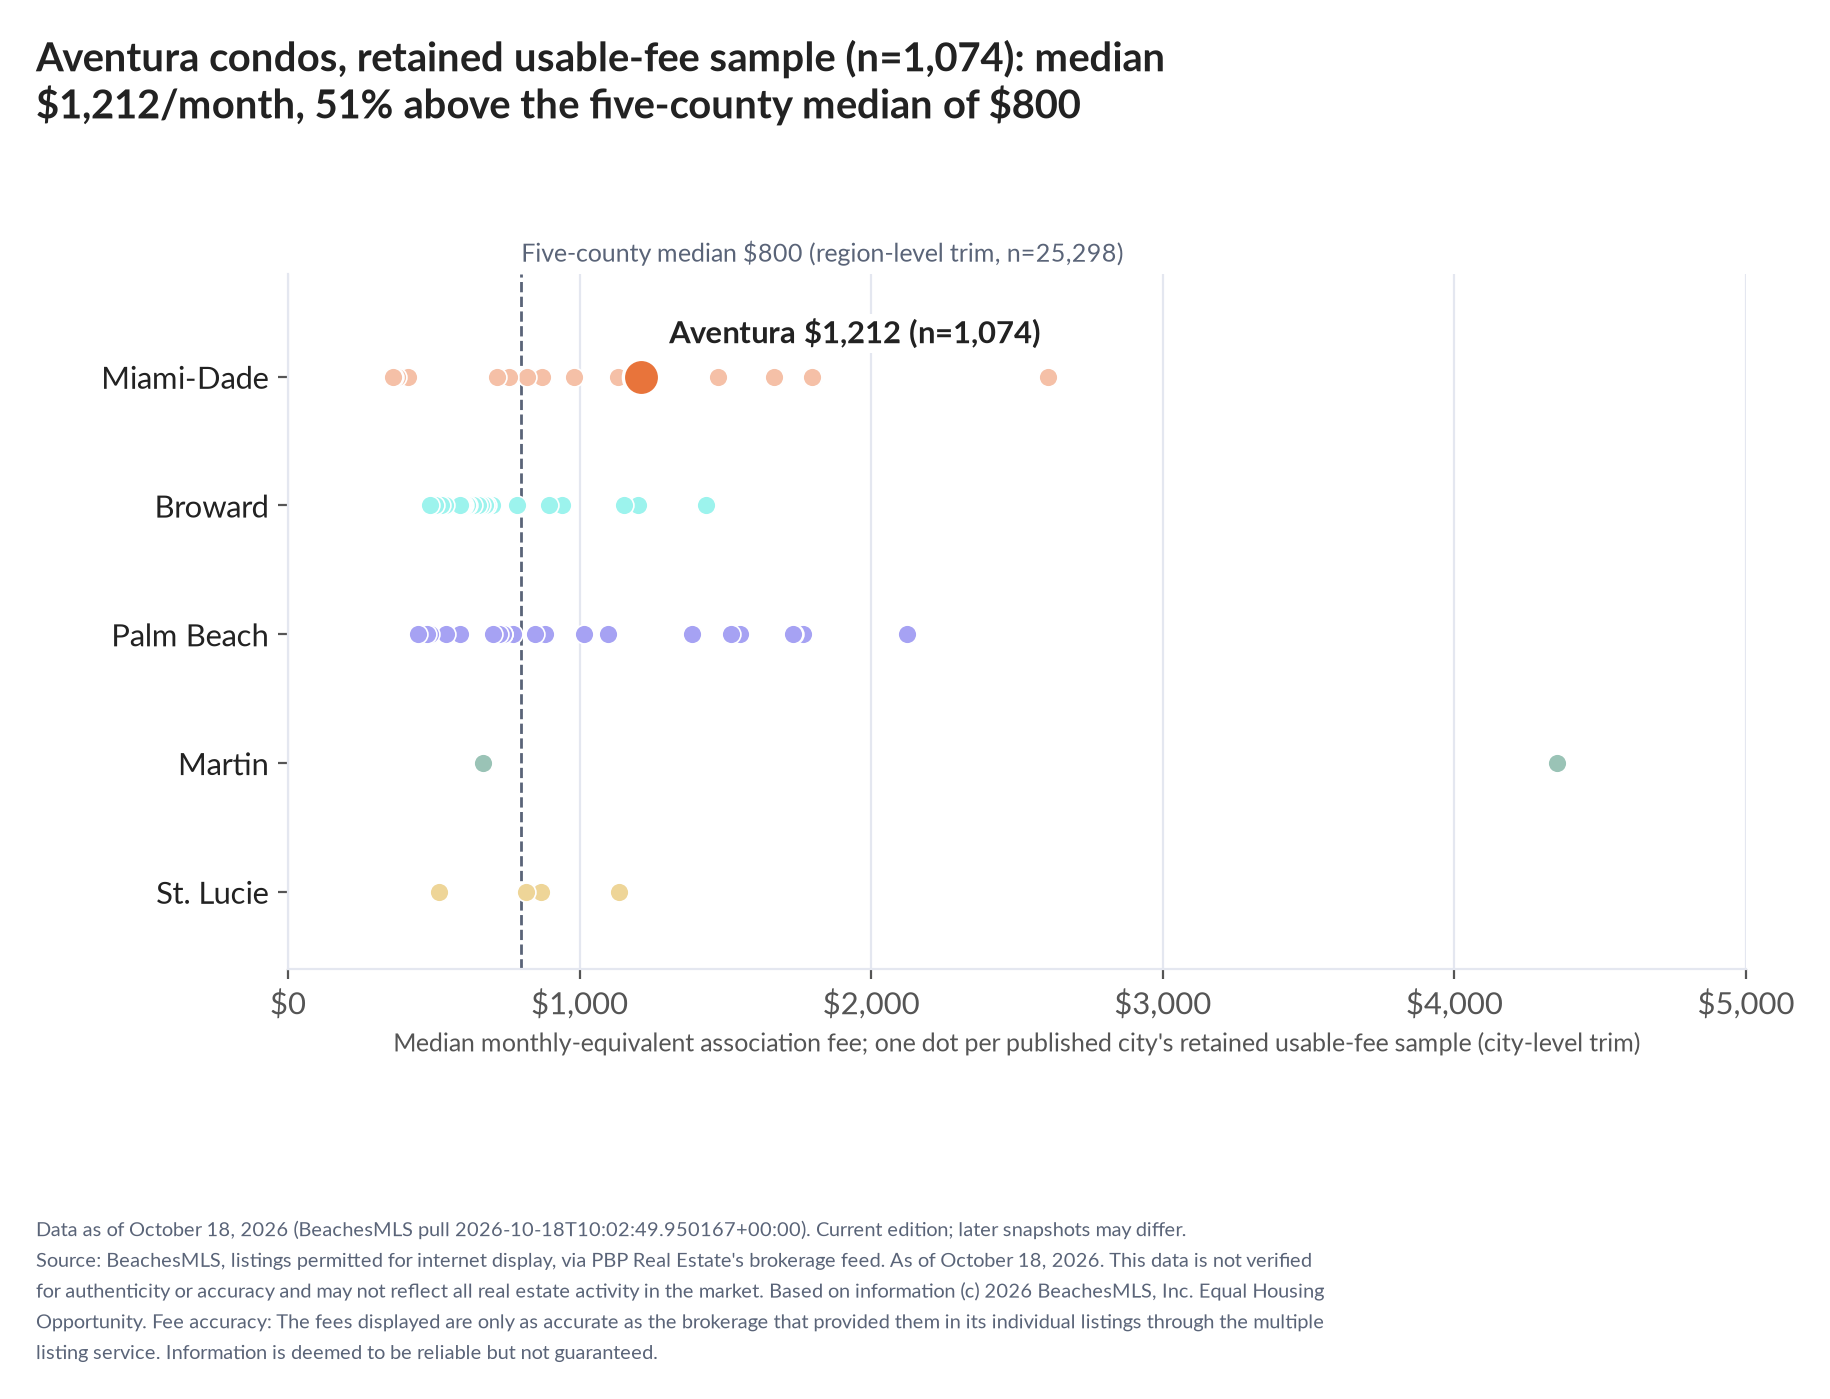
Median monthly-equivalent association fee in the retained usable-fee sample after exclusions and percentile trimming, Aventura and the published comparison cities, grouped by county, October 18, 2026. City medians use city-level trimming; the five-county reference uses a separate region-level trim and is not a median of city medians. A published city requires at least 30 listings with a valid fee before percentile trimming; the retained sample size is stated on the chart. Source: BeachesMLS via PBP Real Estate. Download PNG
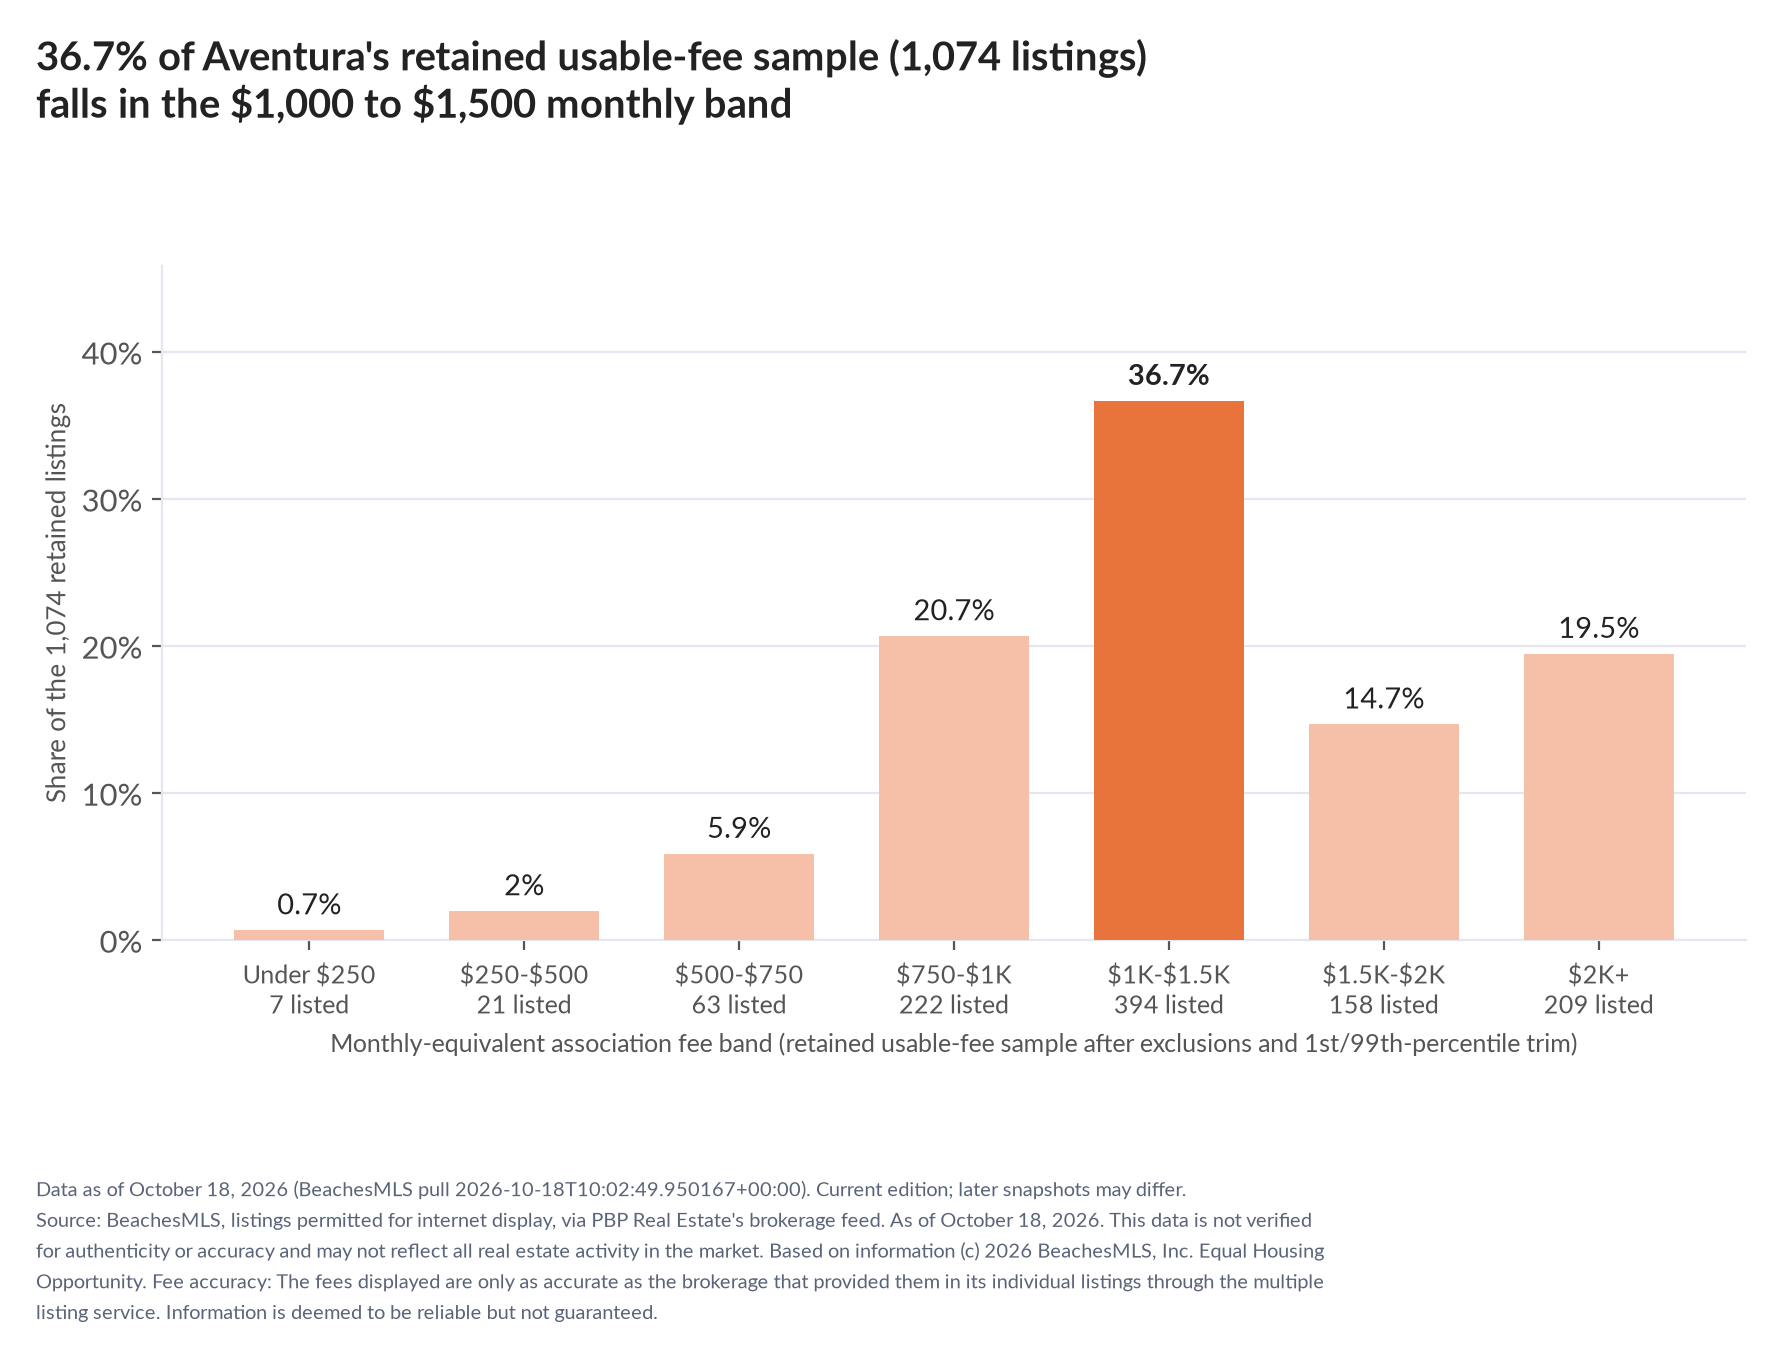
Monthly-equivalent association fee bands for the 1,074 active Aventura condominium listings retained after unusable-fee exclusions and city-level 1st/99th-percentile trimming, October 18, 2026. Shares describe this retained sample, not all active listings. Source: BeachesMLS via PBP Real Estate. Download PNG
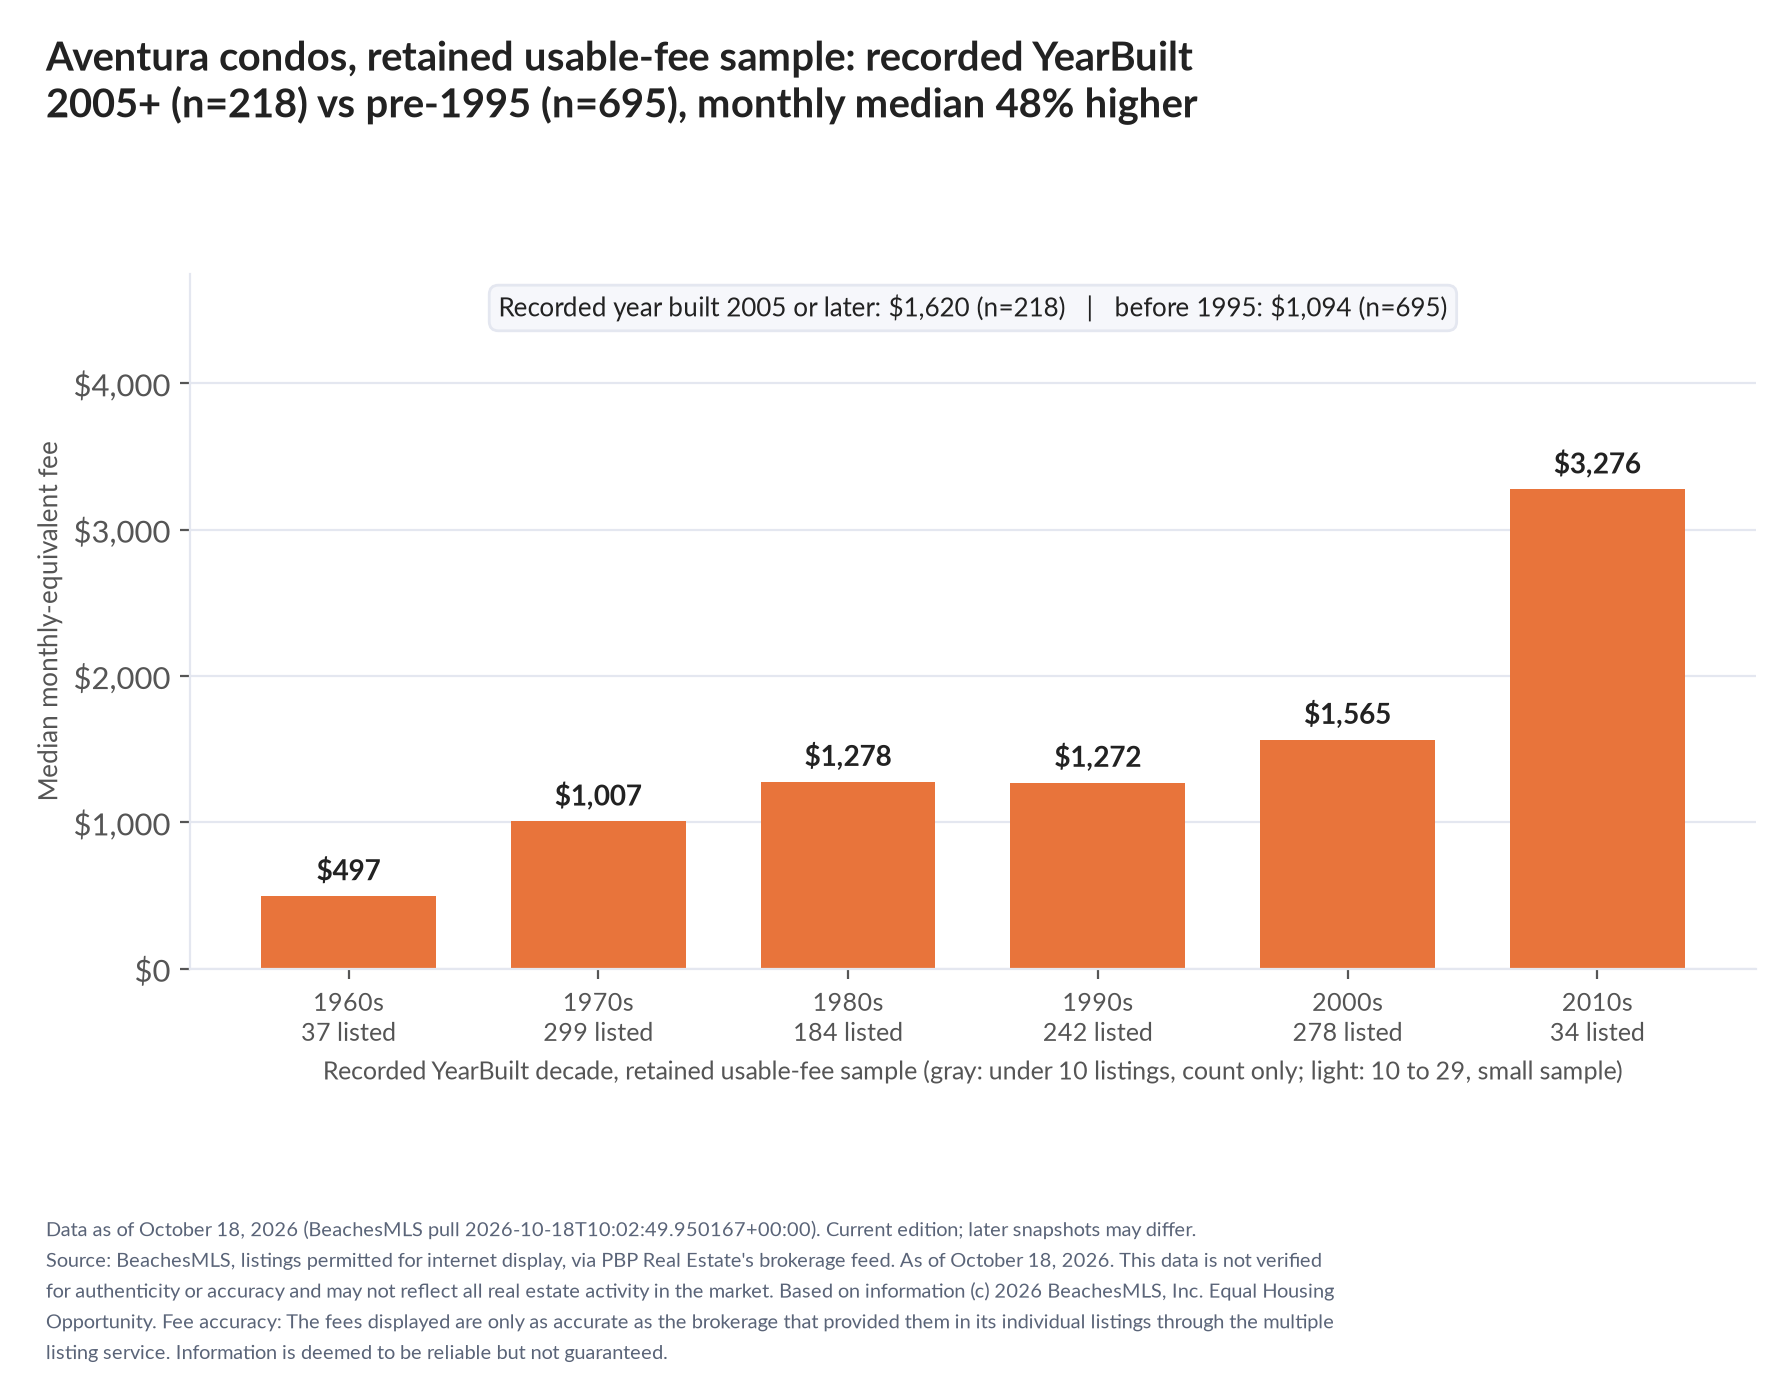
Median monthly-equivalent association fee by recorded YearBuilt decade among Aventura condominiums in the retained usable-fee sample after exclusions and percentile trimming, October 18, 2026. Each decade uses the retained records with a recorded construction year; decades under 10 listings shown gray with a count only. Source: BeachesMLS via PBP Real Estate. Recorded YearBuilt 2005+ n=218; pre-1995 n=695. Download PNG
Downloads and methodology
Journalist package: PDF · Plain text · ZIP with charts. Method: South Florida Condo Fee Index method. Current edition. A later snapshot may differ; this file describes only the date above.
How to cite this release
Attribution: PBP Real Estate analysis of BeachesMLS listing data, listings as of October 18, 2026. For a figure that must not change after publication, cite the dated file names in the downloads above or the frozen monthly edition.
Comment and licensed quotes: Gia Freer, Broker of Record (Lic. BK689801), and Grant Freer, Owner and Broker Associate, 561-395-8418 · info@pbpre.com. How figures are sourced, reviewed and corrected: editorial and corrections policy.
Every current city kit: press kits. Corrections: corrections log.
This data is not verified for authenticity or accuracy and may not reflect all real estate activity in the market. Based on information © 2026 BeachesMLS, Inc. Listings permitted for internet display. Nothing on this page is an opinion of value about any property. Equal Housing Opportunity.

All listings featuring the BMLS logo are provided by BeachesMLS, Inc. This information is not verified for authenticity or accuracy and is not guaranteed. Copyright © 2026 BeachesMLS, Inc.
IDX information is provided exclusively for consumers' personal, non-commercial use, and may not be used for any purpose other than to identify prospective properties consumers may be interested in purchasing. Data is deemed reliable but is not guaranteed accurate by the MLS. Data last updated October 18, 2026.